GET THE #1 EMAIL FOR EXECUTIVES
Subscribe to get the weekly email newsletter loved by 1000+ executives. It's FREE!

From the recent Paris Olympic Debrief Post I got a lot of positive feedback about the photography! So I thought that I would weave more imagery where it is relevent to the posts going forward.
On the same trip to the Olympics I also visited London and the Winston Churchill War Rooms with my brother. This is the underground bunker that Winston Churchill and his cabinet, ran the war effort from during World War II.
To set the scene, this is what it is like above the ground.

Those taxis are so fun to photograph.


You go into this underground bunker and it is where Winston Churchill and his team ran the war effort during World War II.
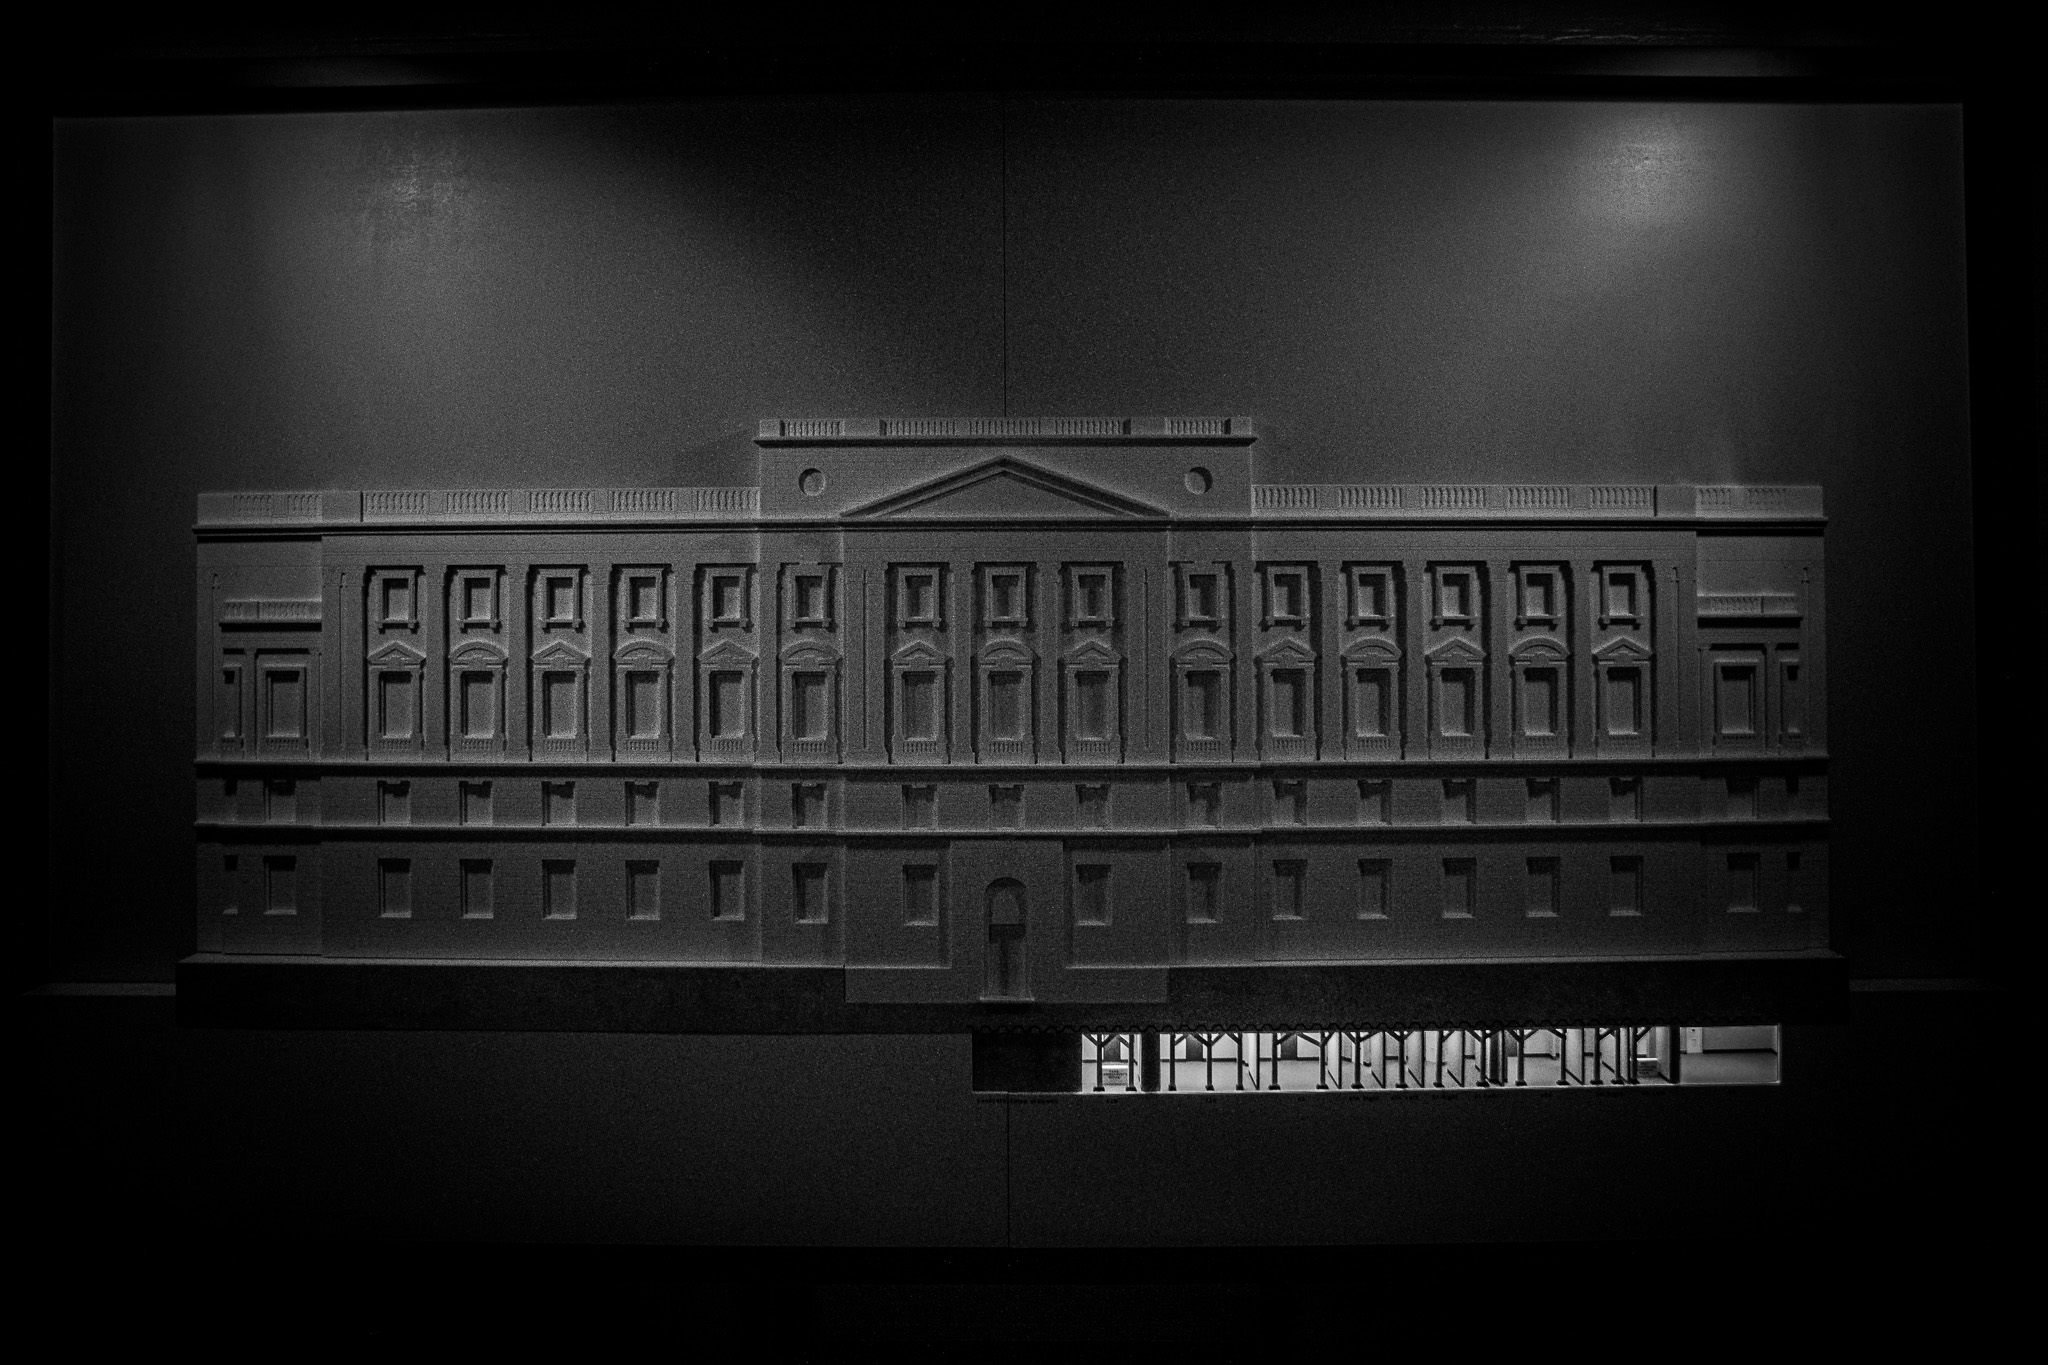
Here is the schematic plan of the building, with the war rooms shown highlighted underneath the building, the idea being that they were safe even in the case of a direct hit from a bomb.
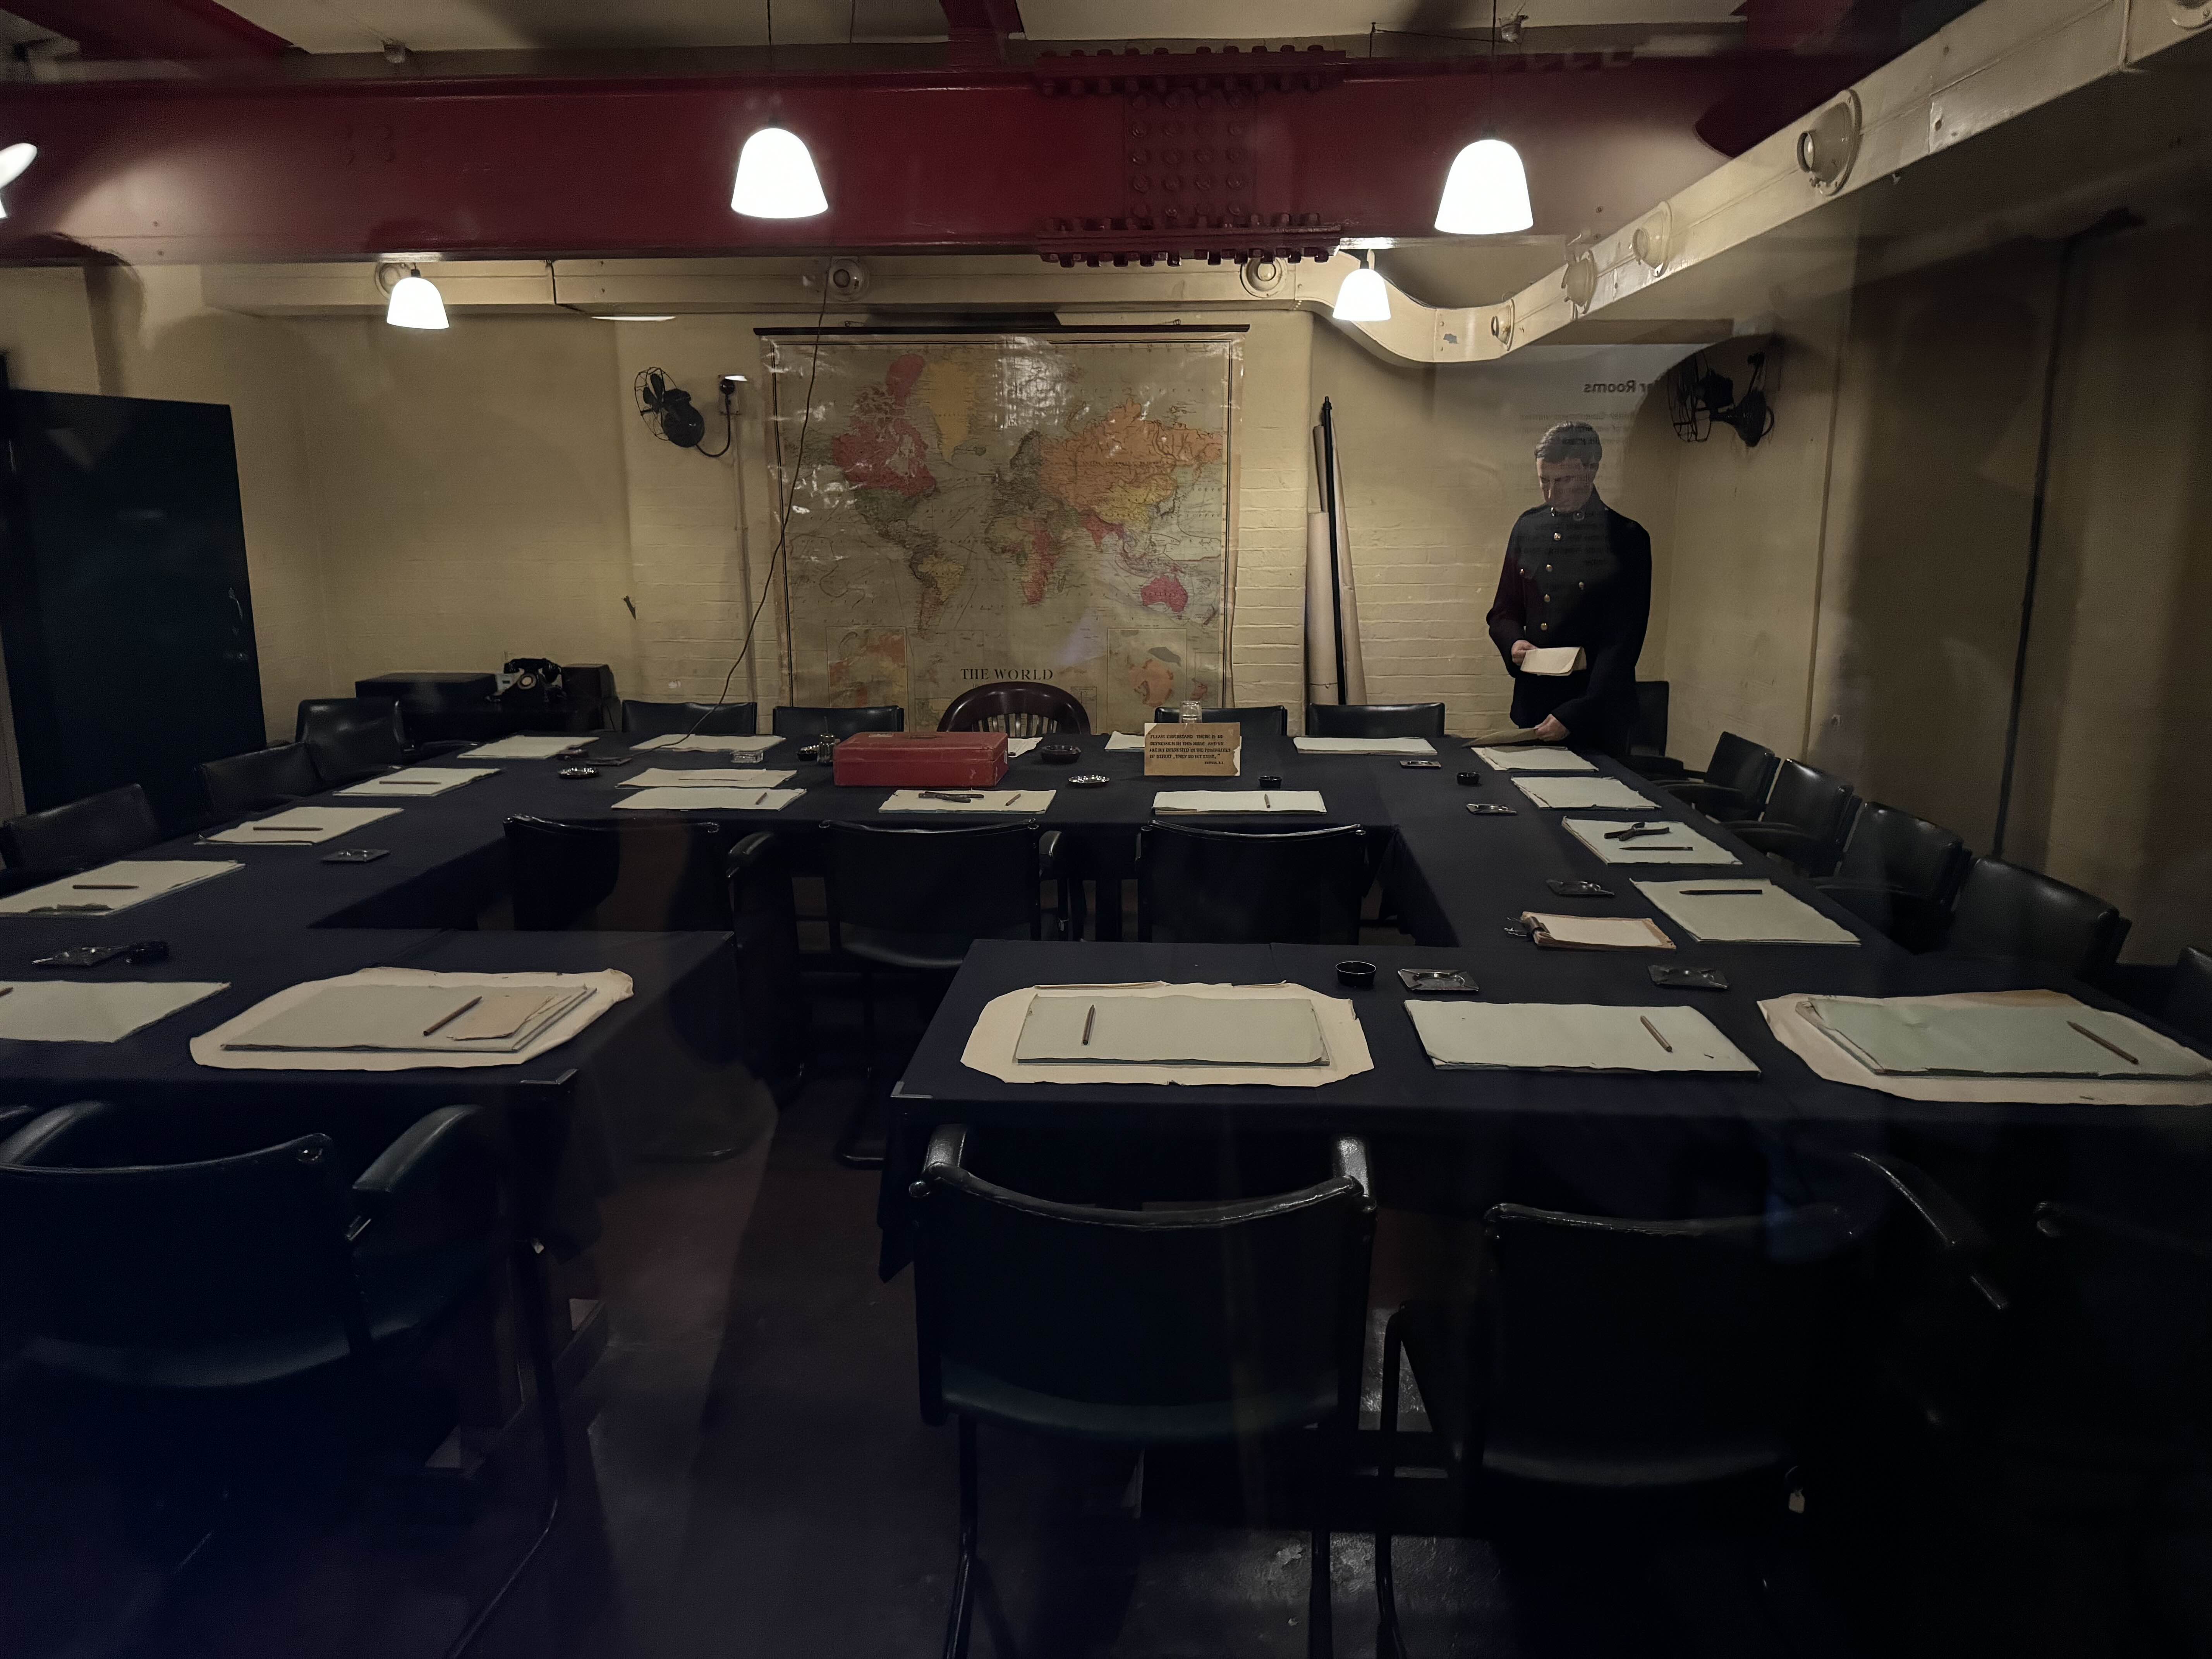
This is the room that Churchill sat around with his cabinet and made decisions that would change the course of history.
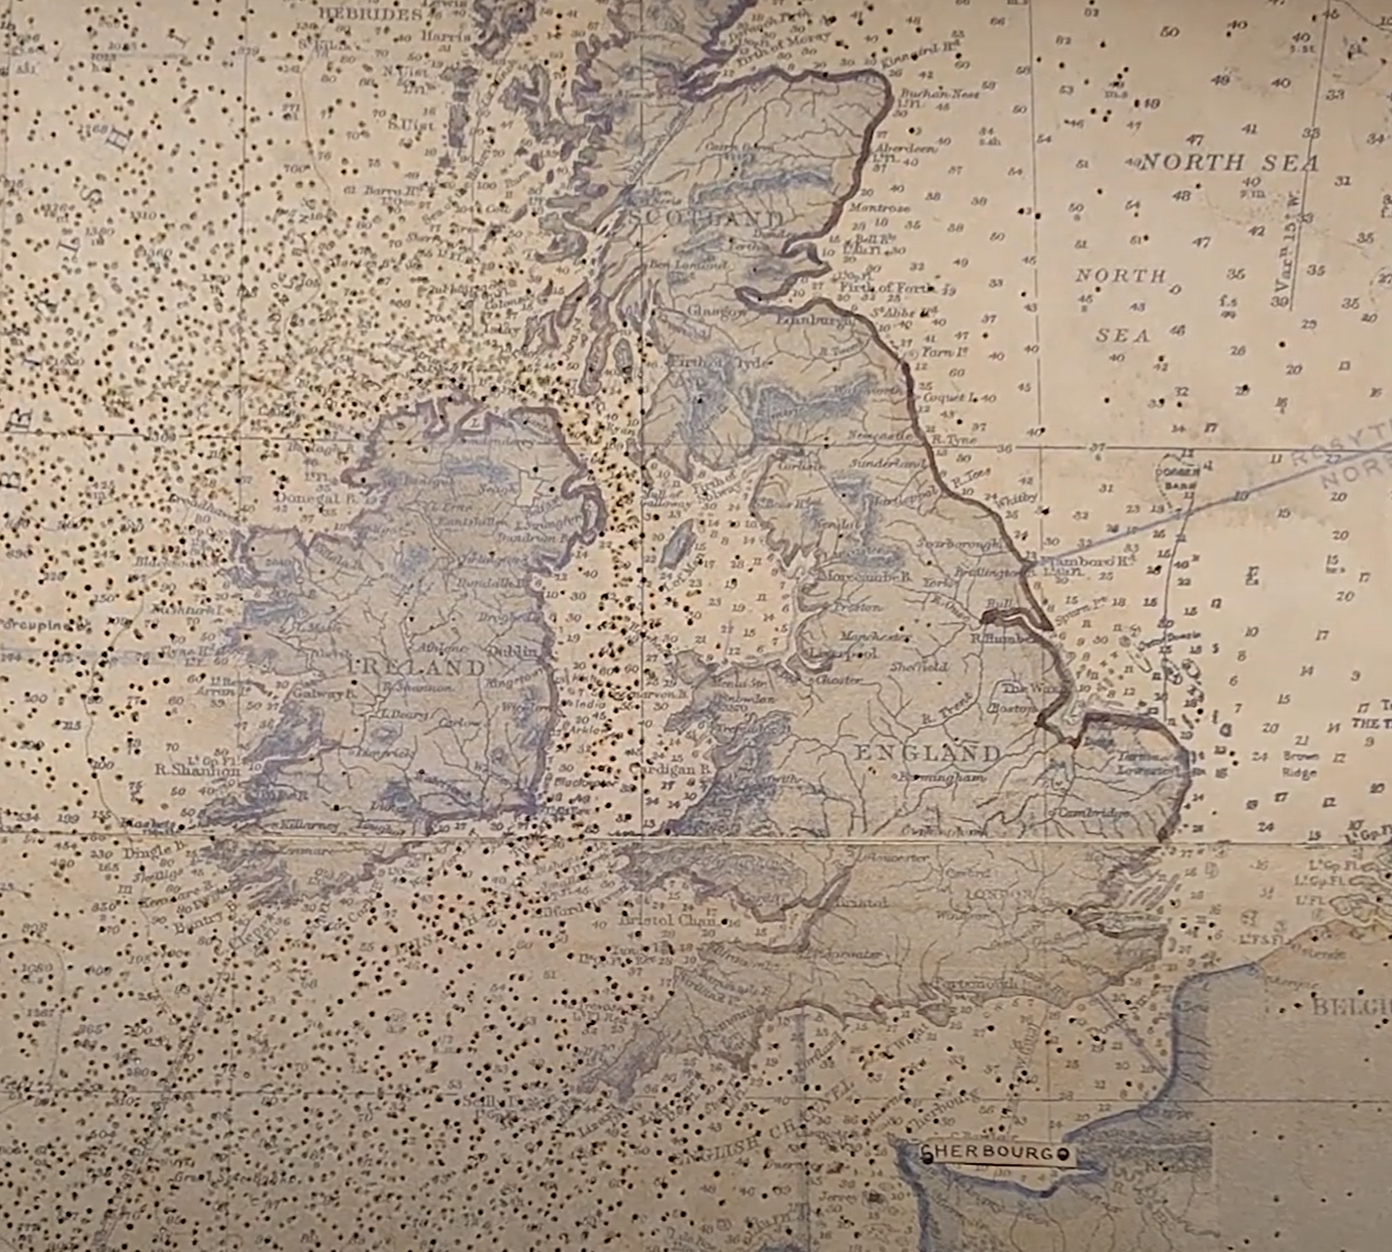
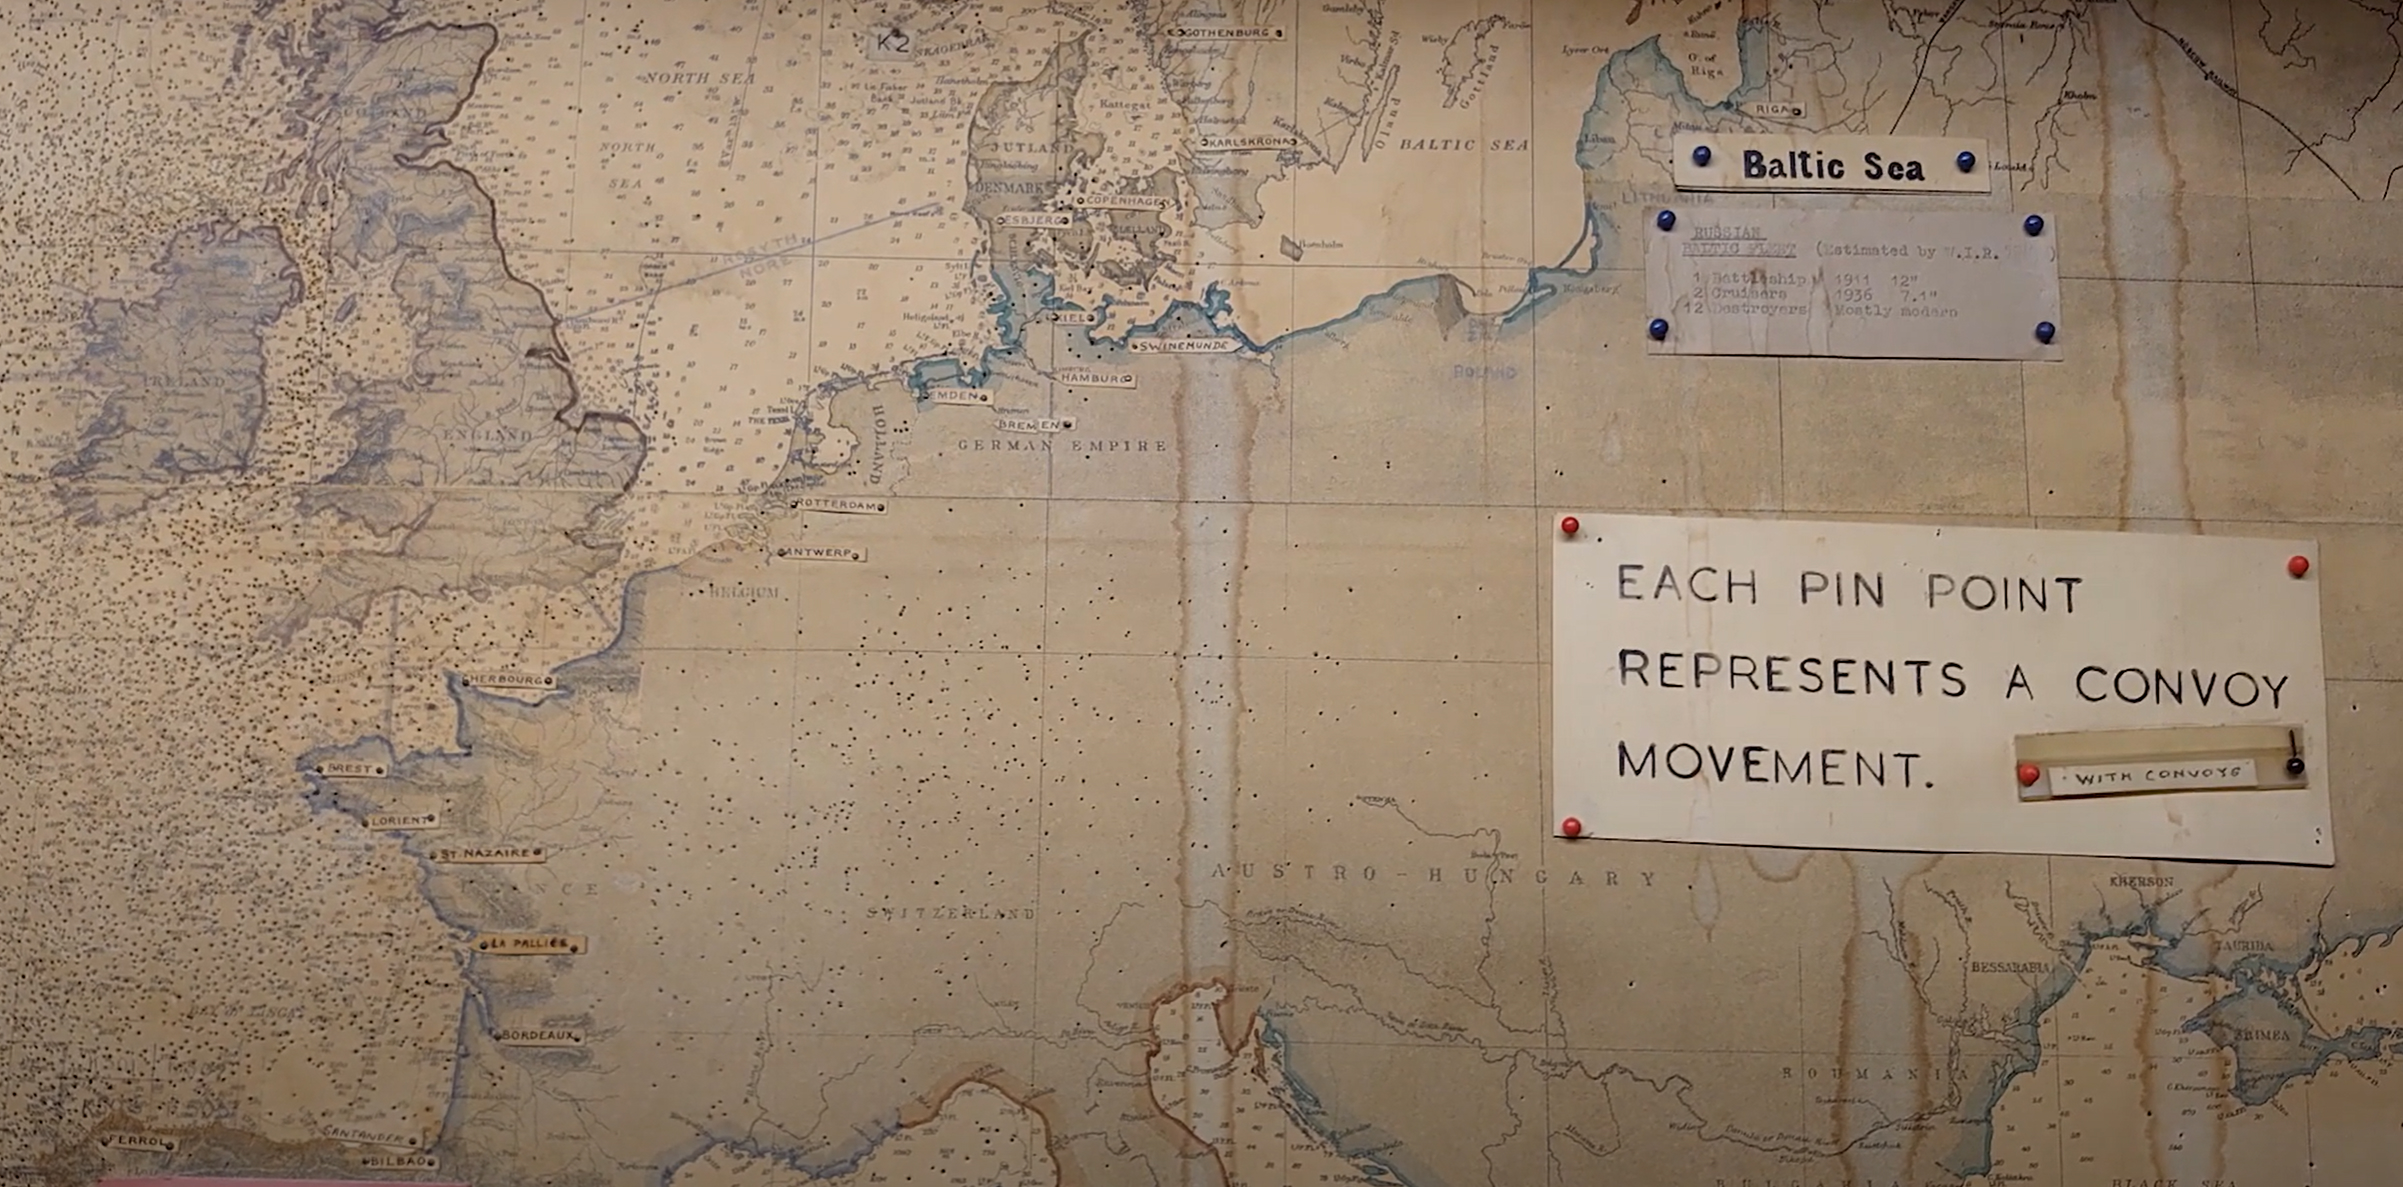
I liked seeing the maps, there were millions of pin marks on them, showing the locations of the troops and the enemy. It also shows what life was like before Power BI, GPS and computers.
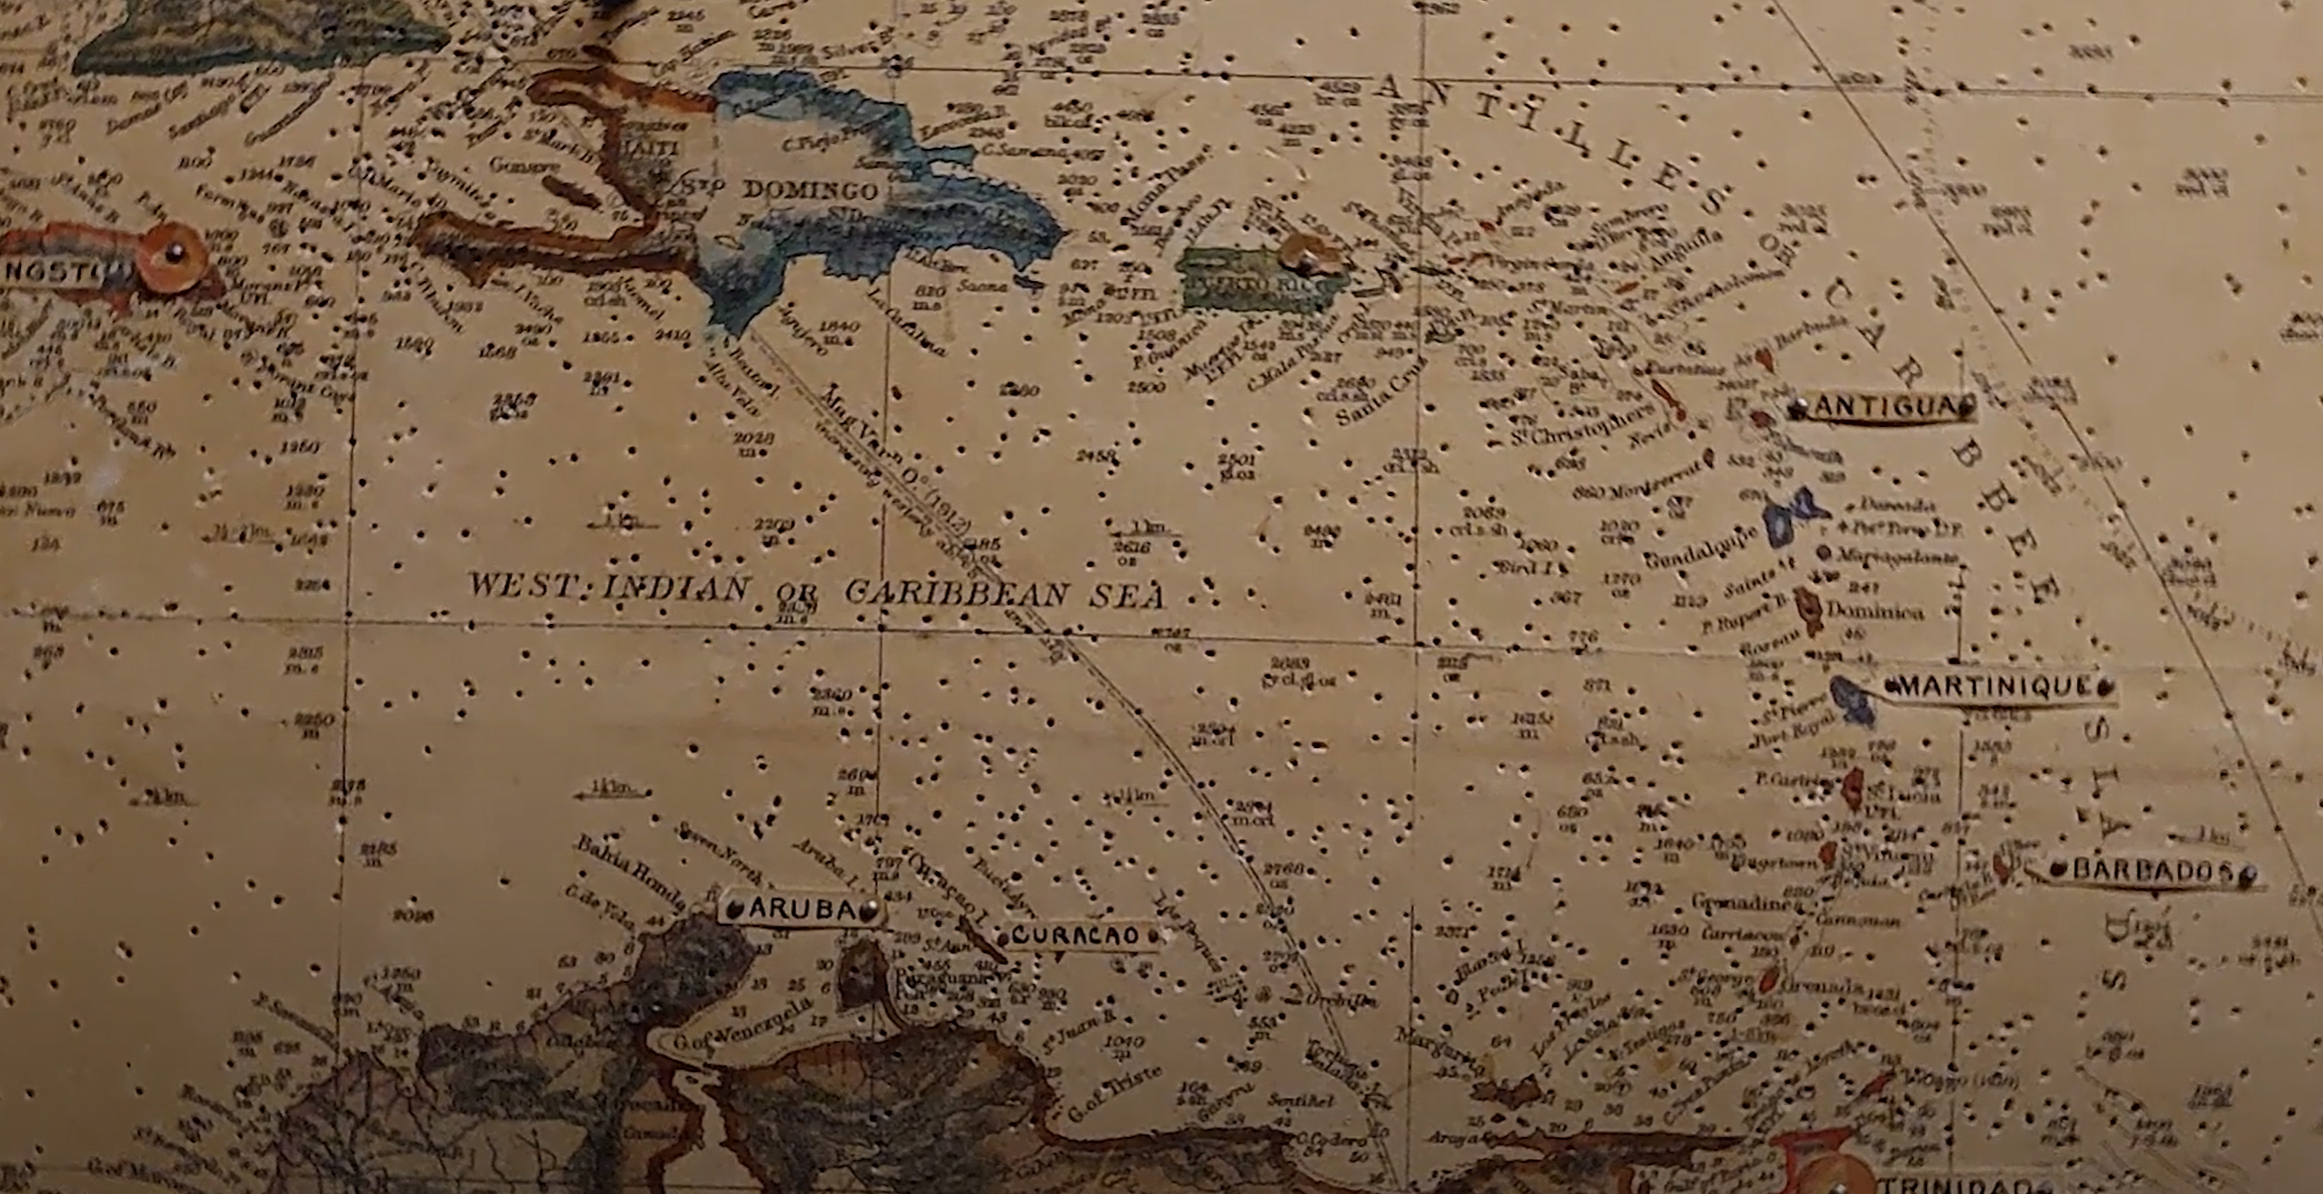
There were literally millions of pin marks.
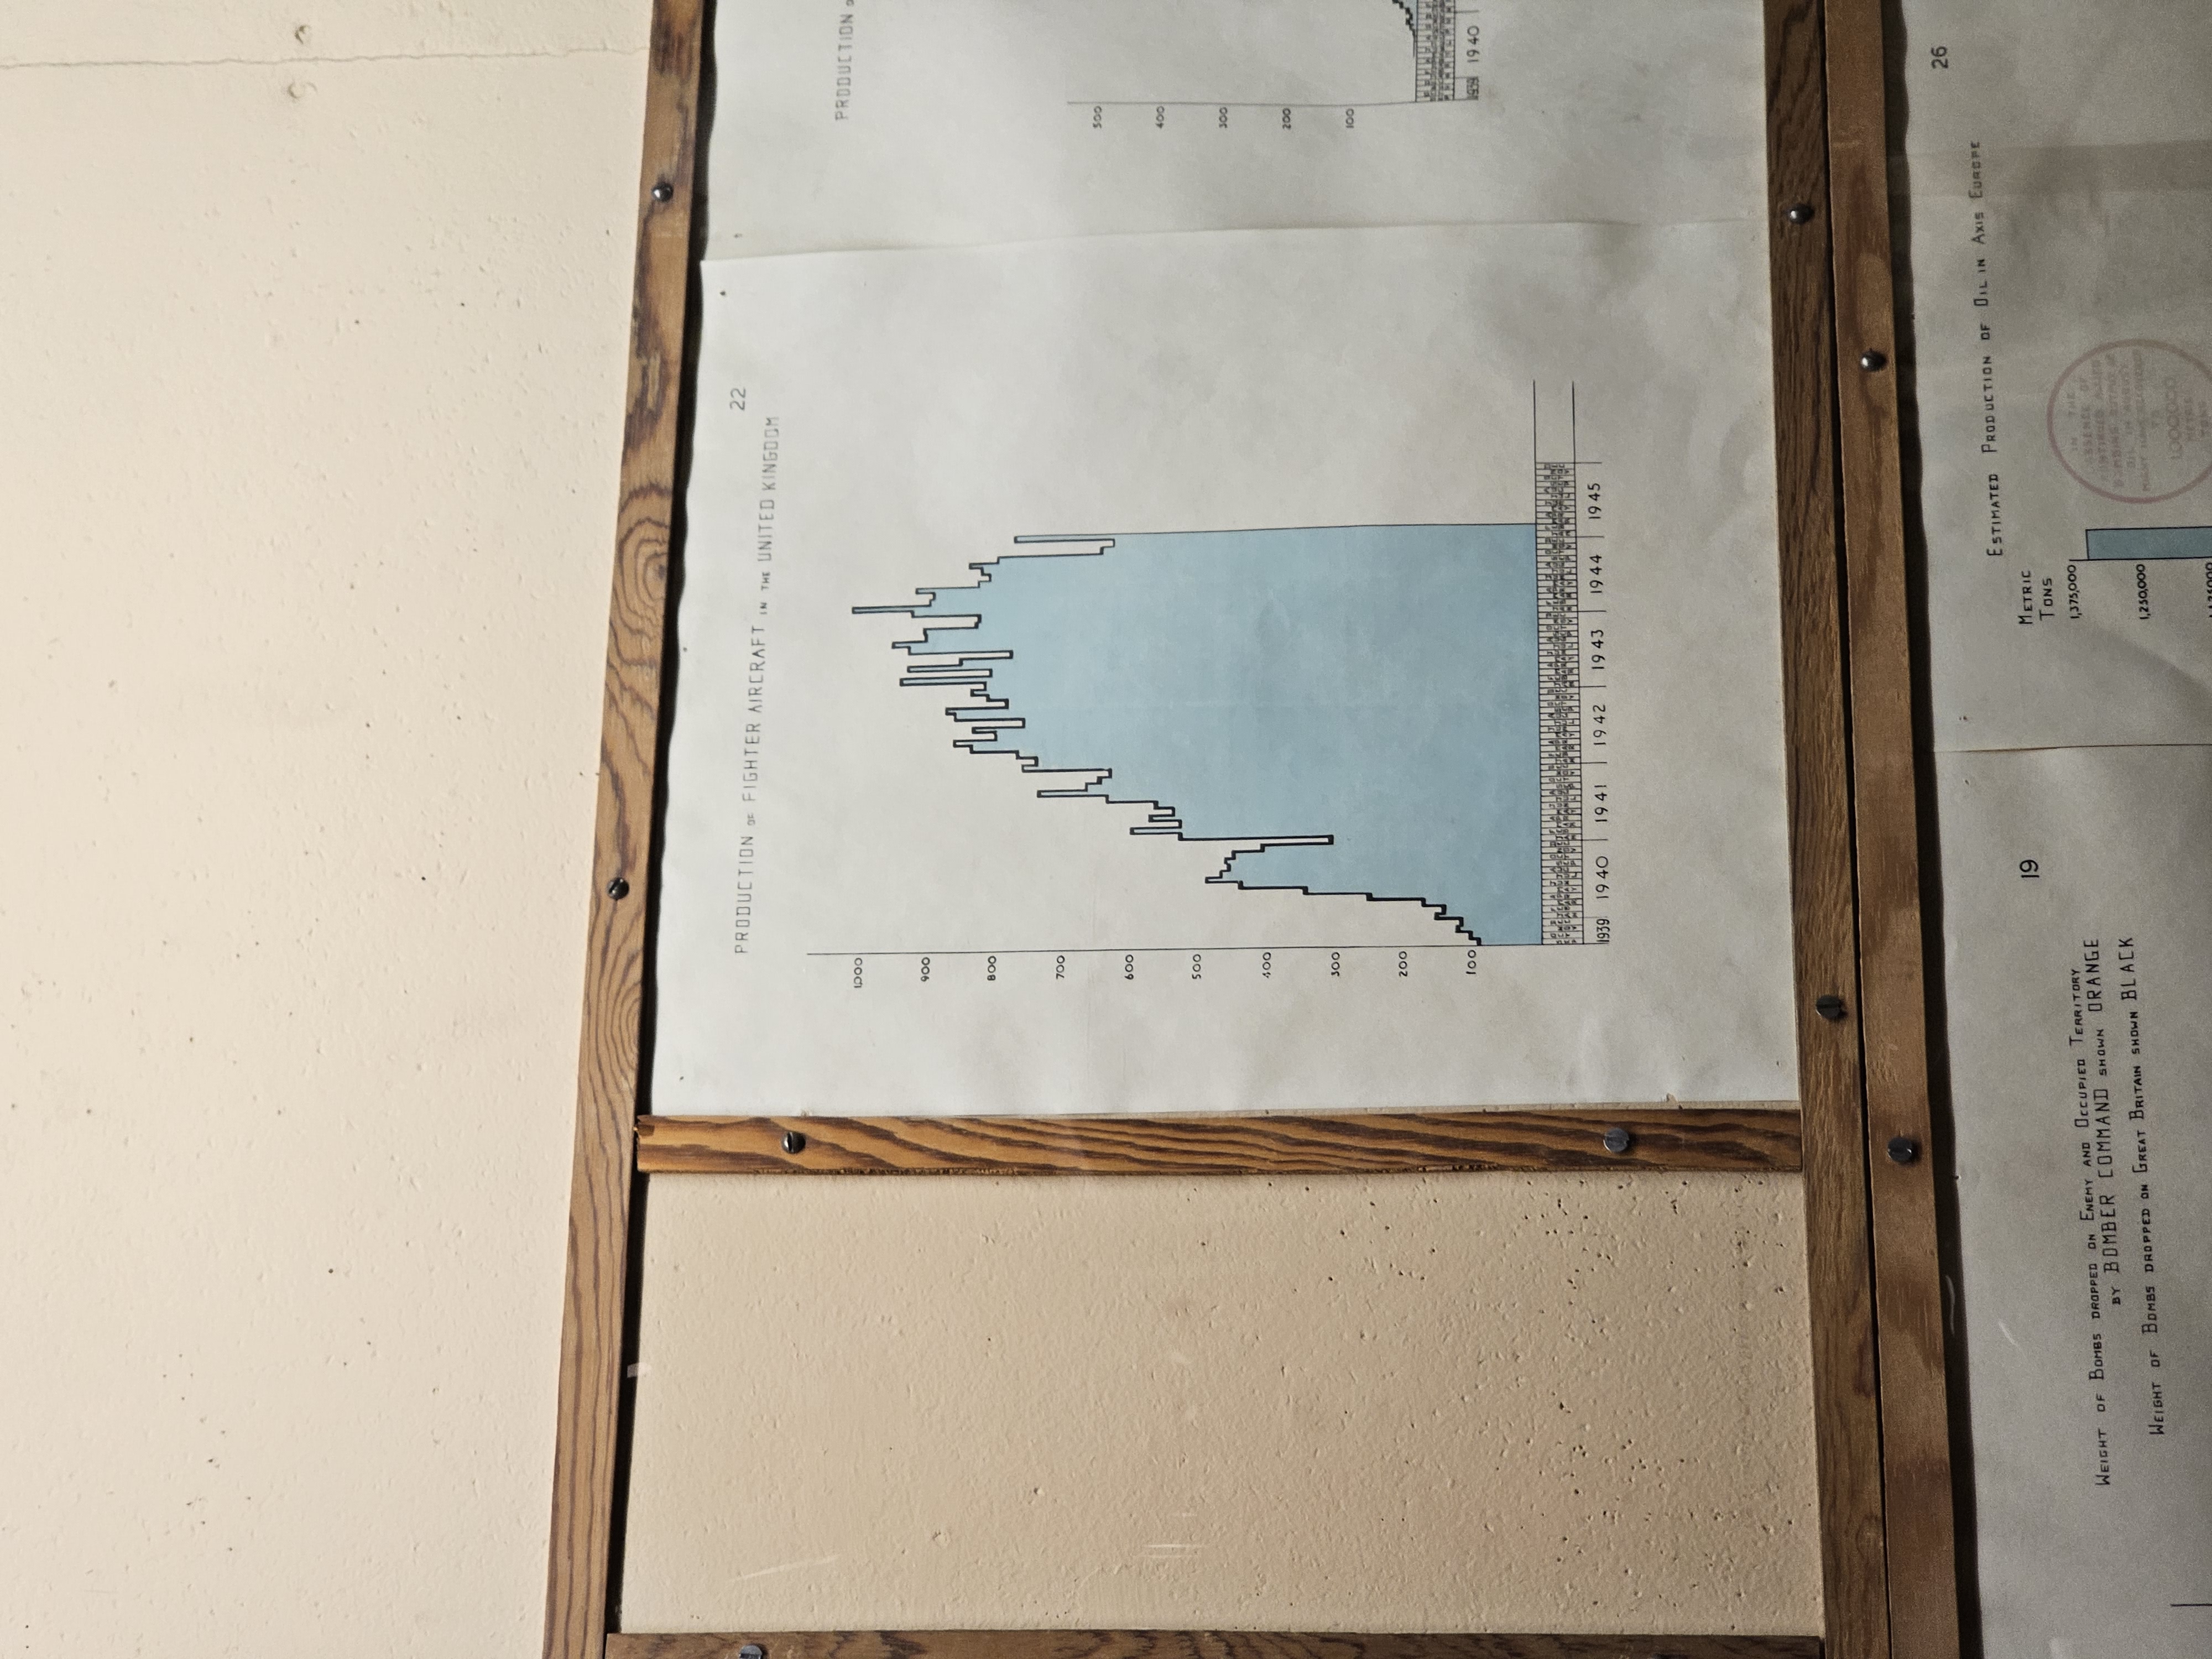
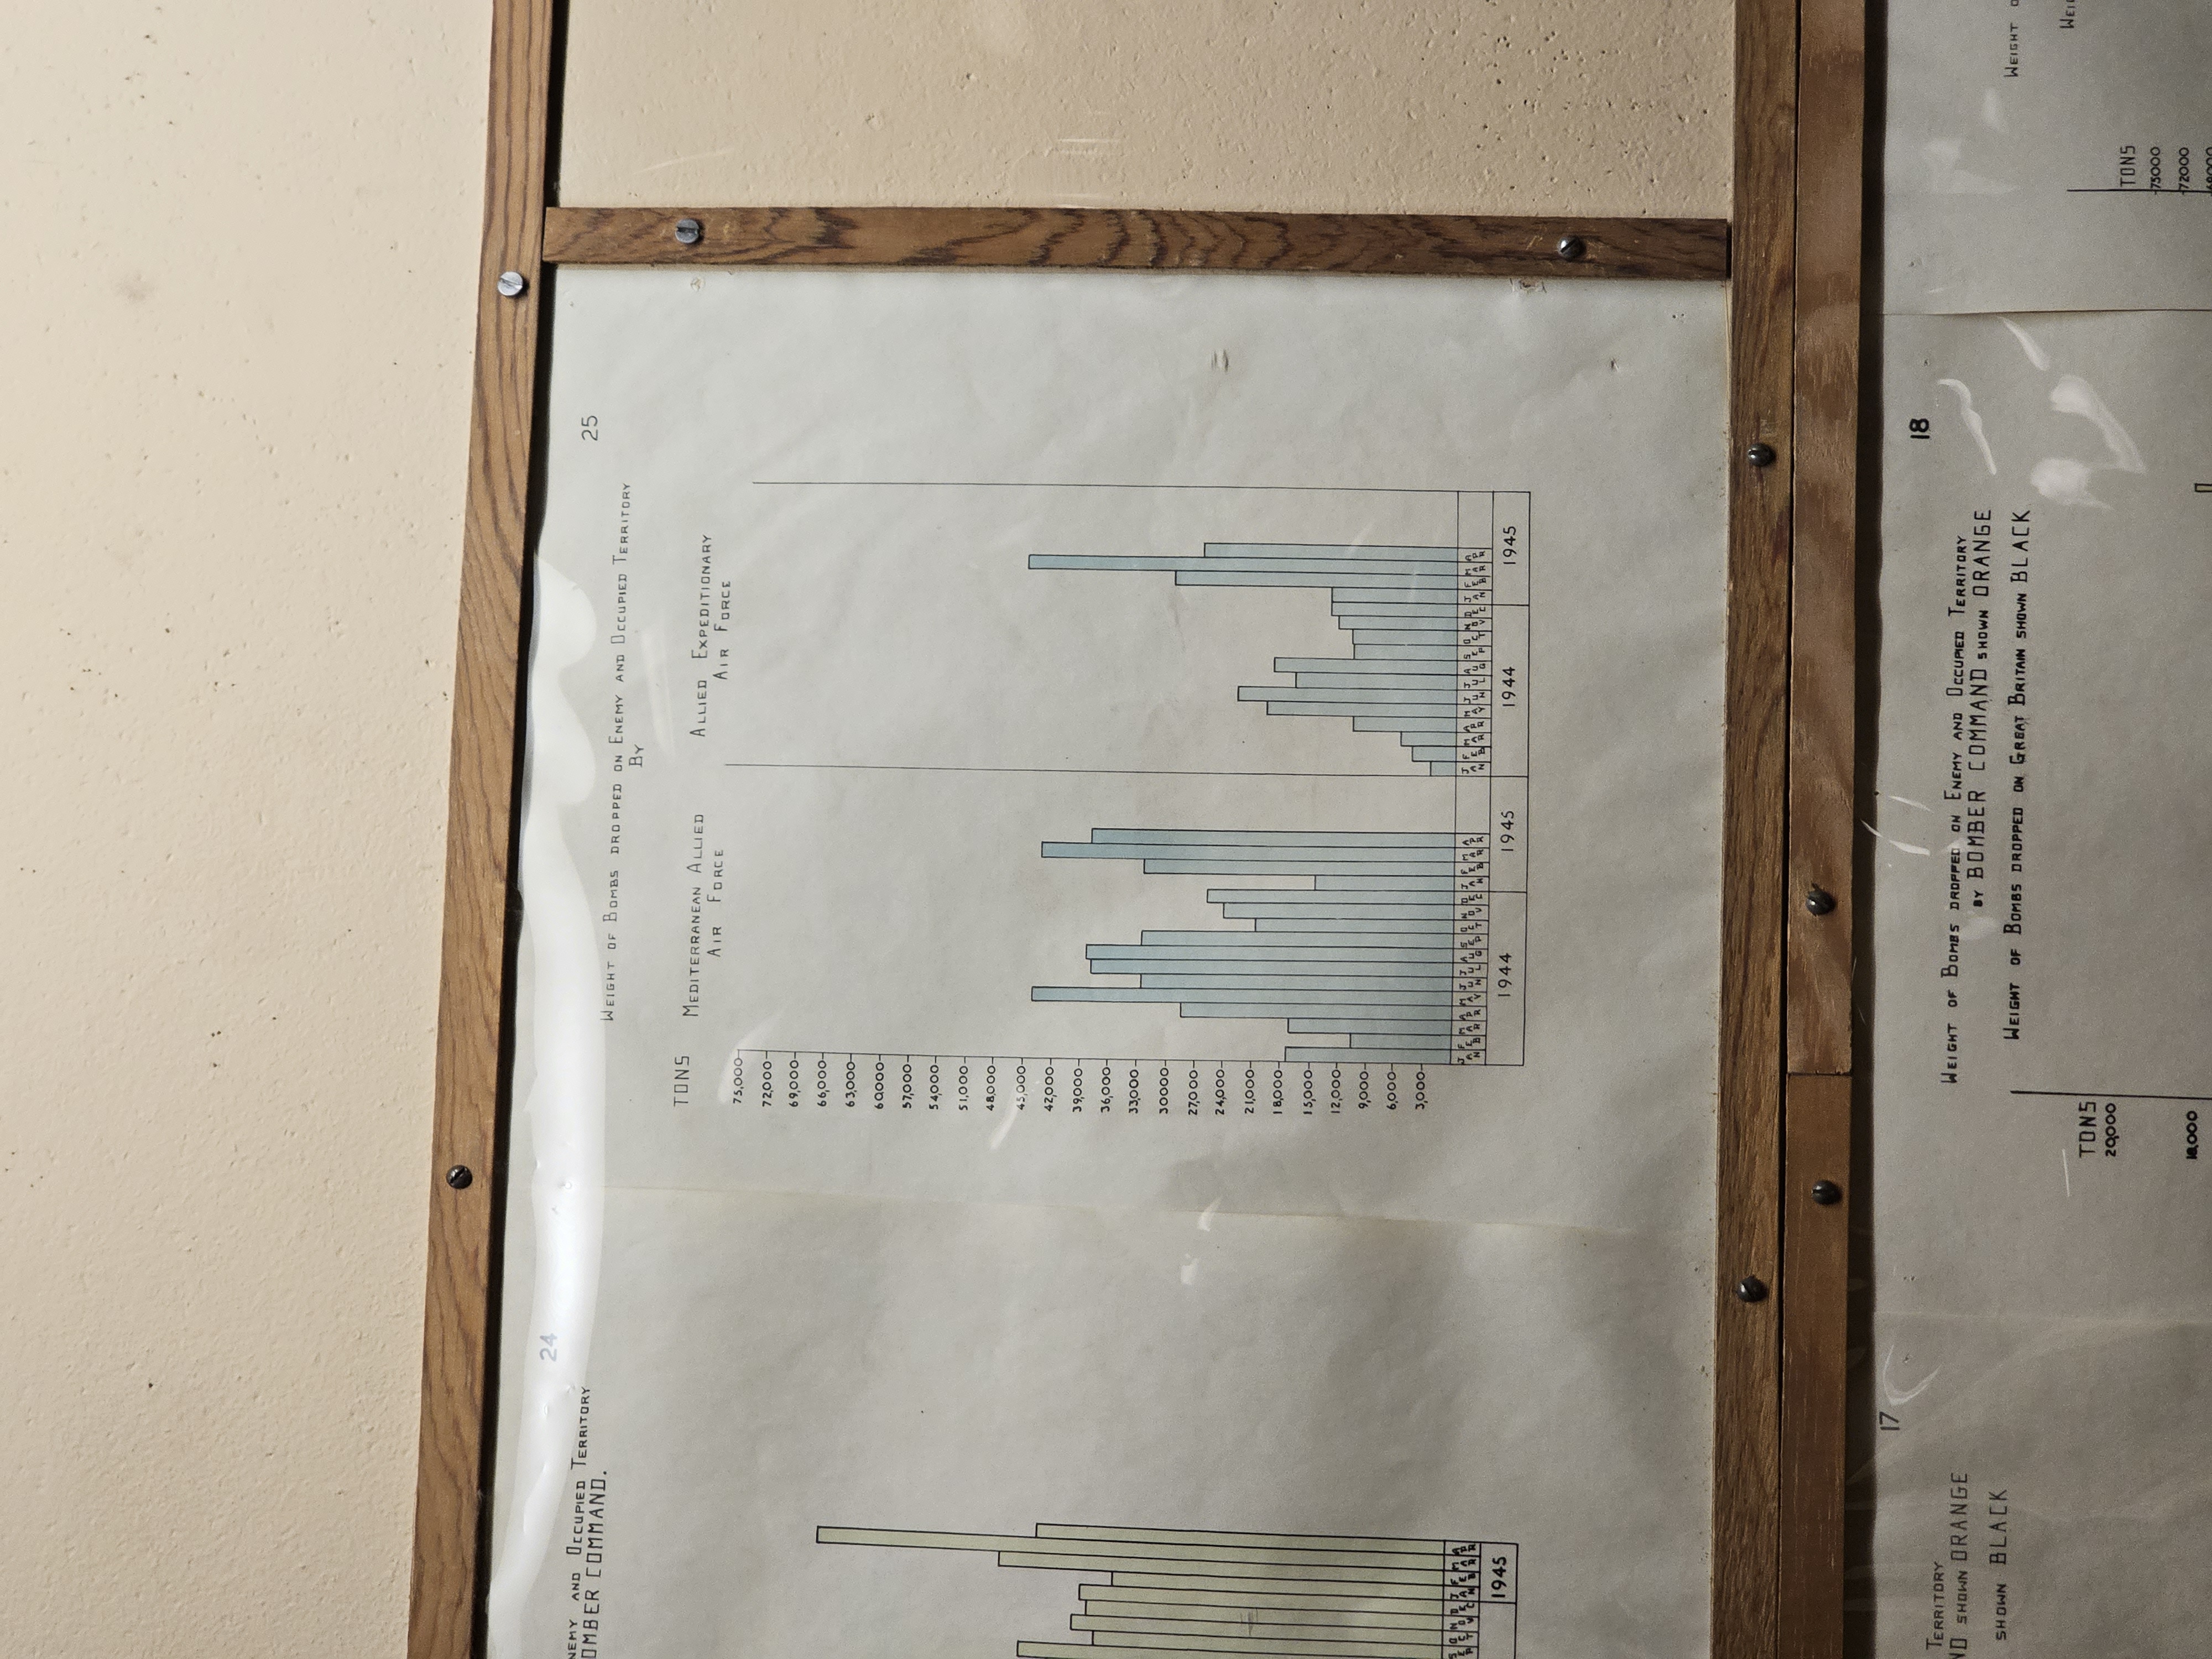
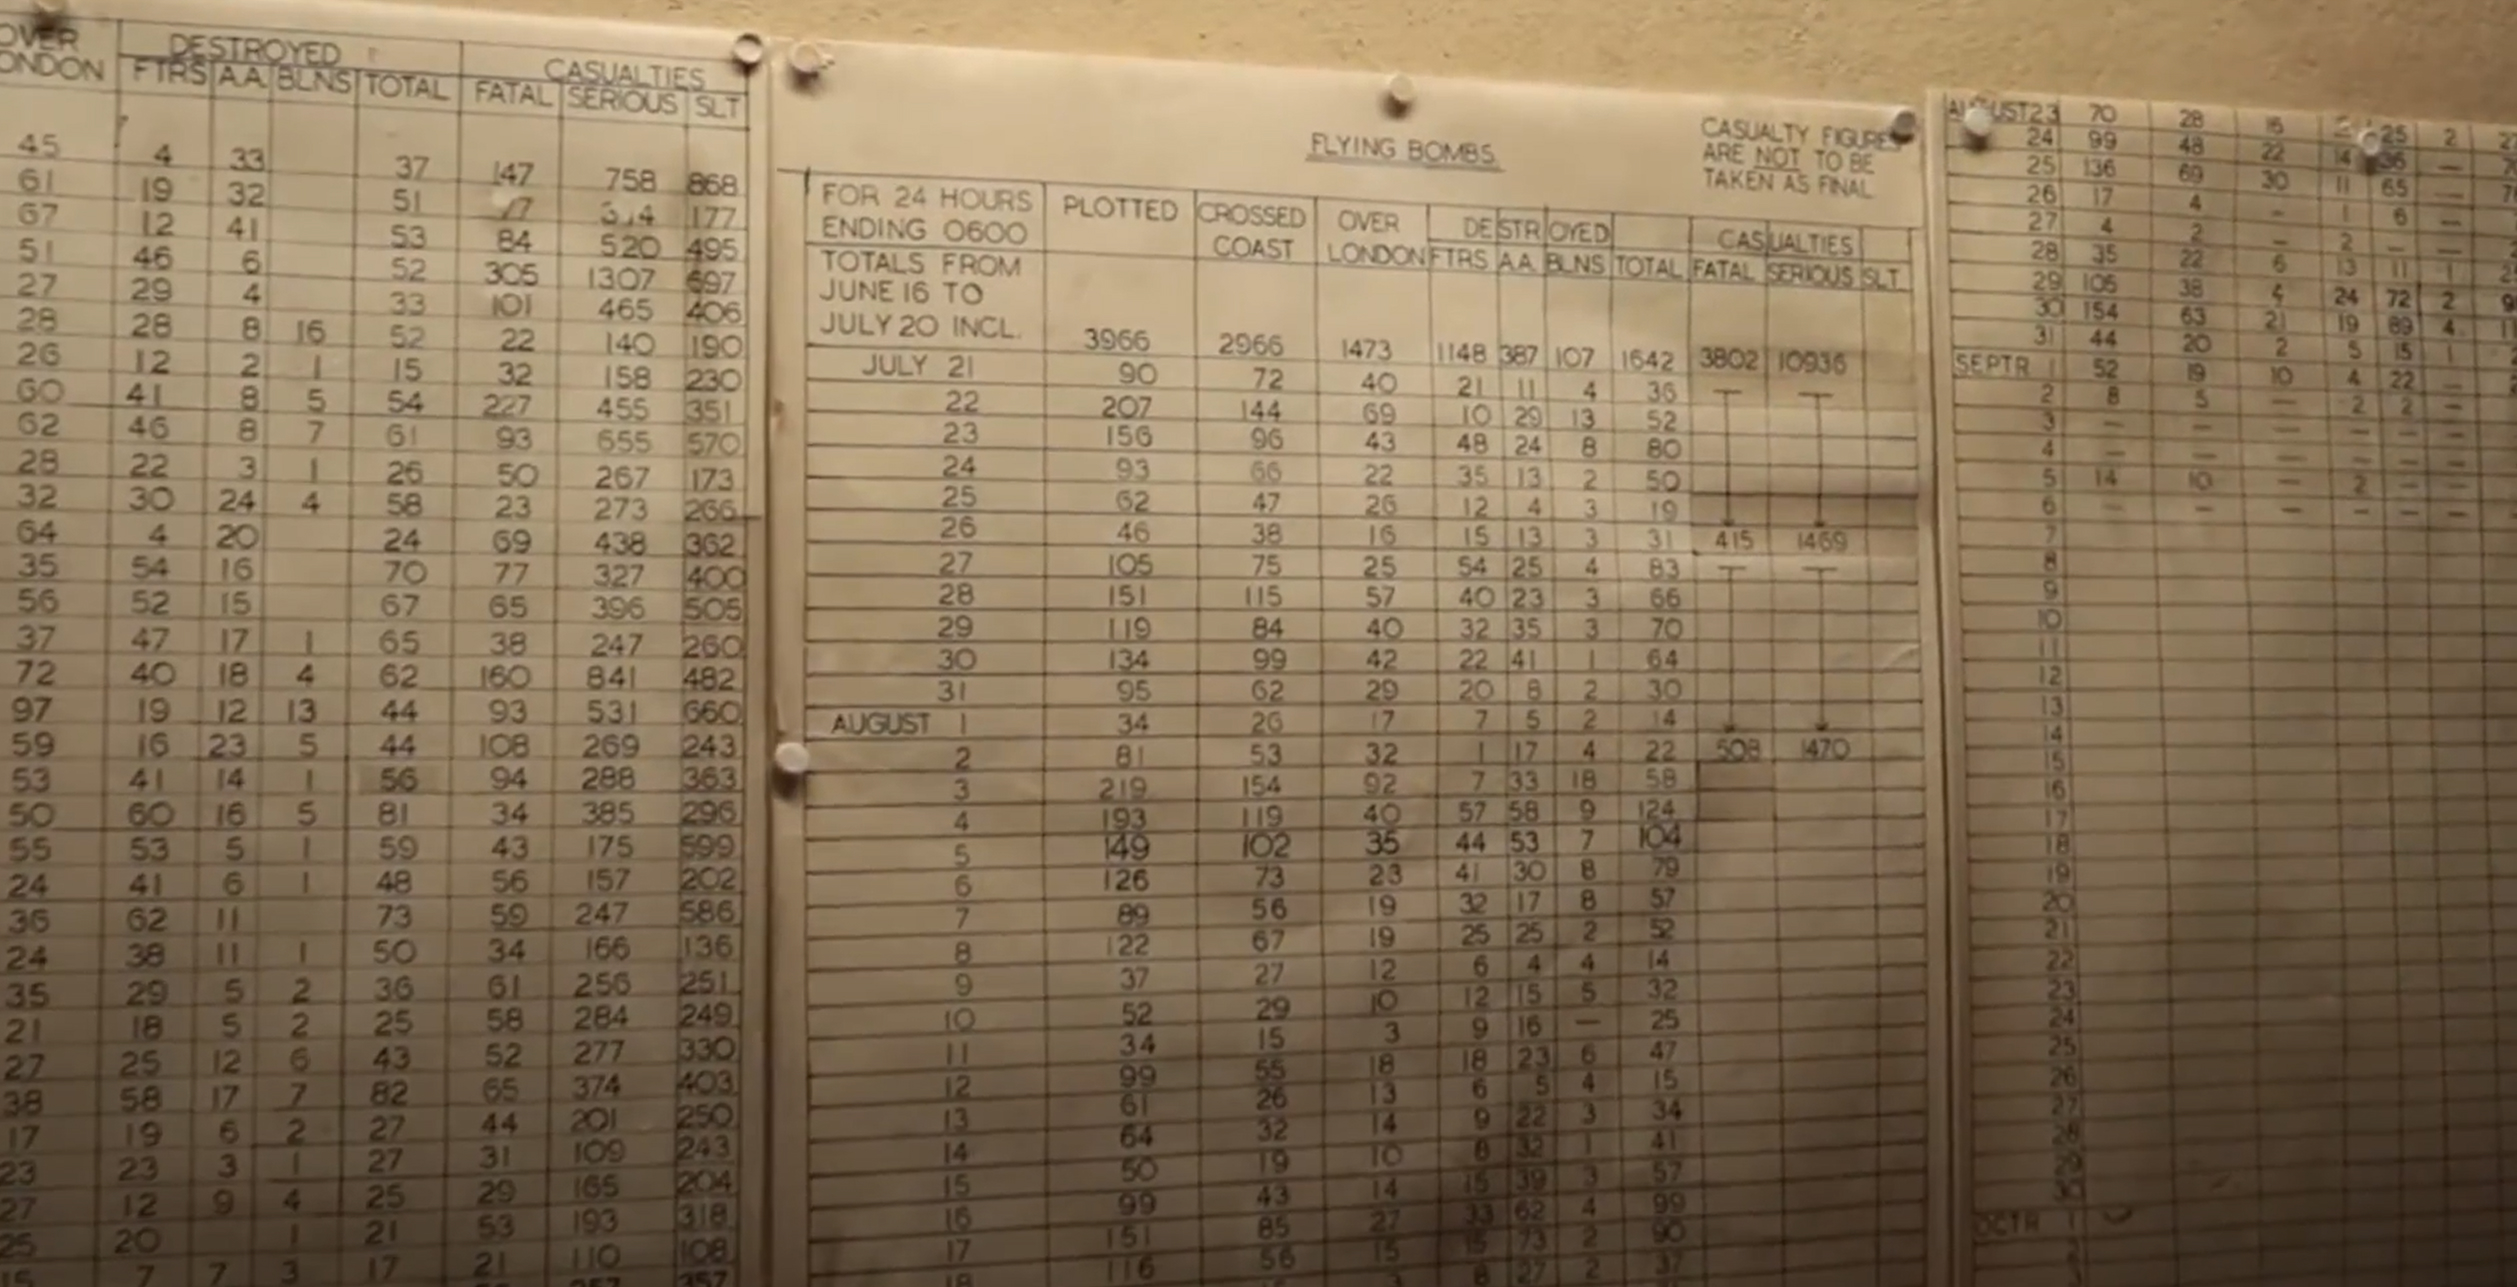
What really captured my attention was the hand drawn graphs. There were so many of these charts and graphs hanging on various different walls.
It's incredible to think that they derived all of these insights without the use of the internet or Power BI.
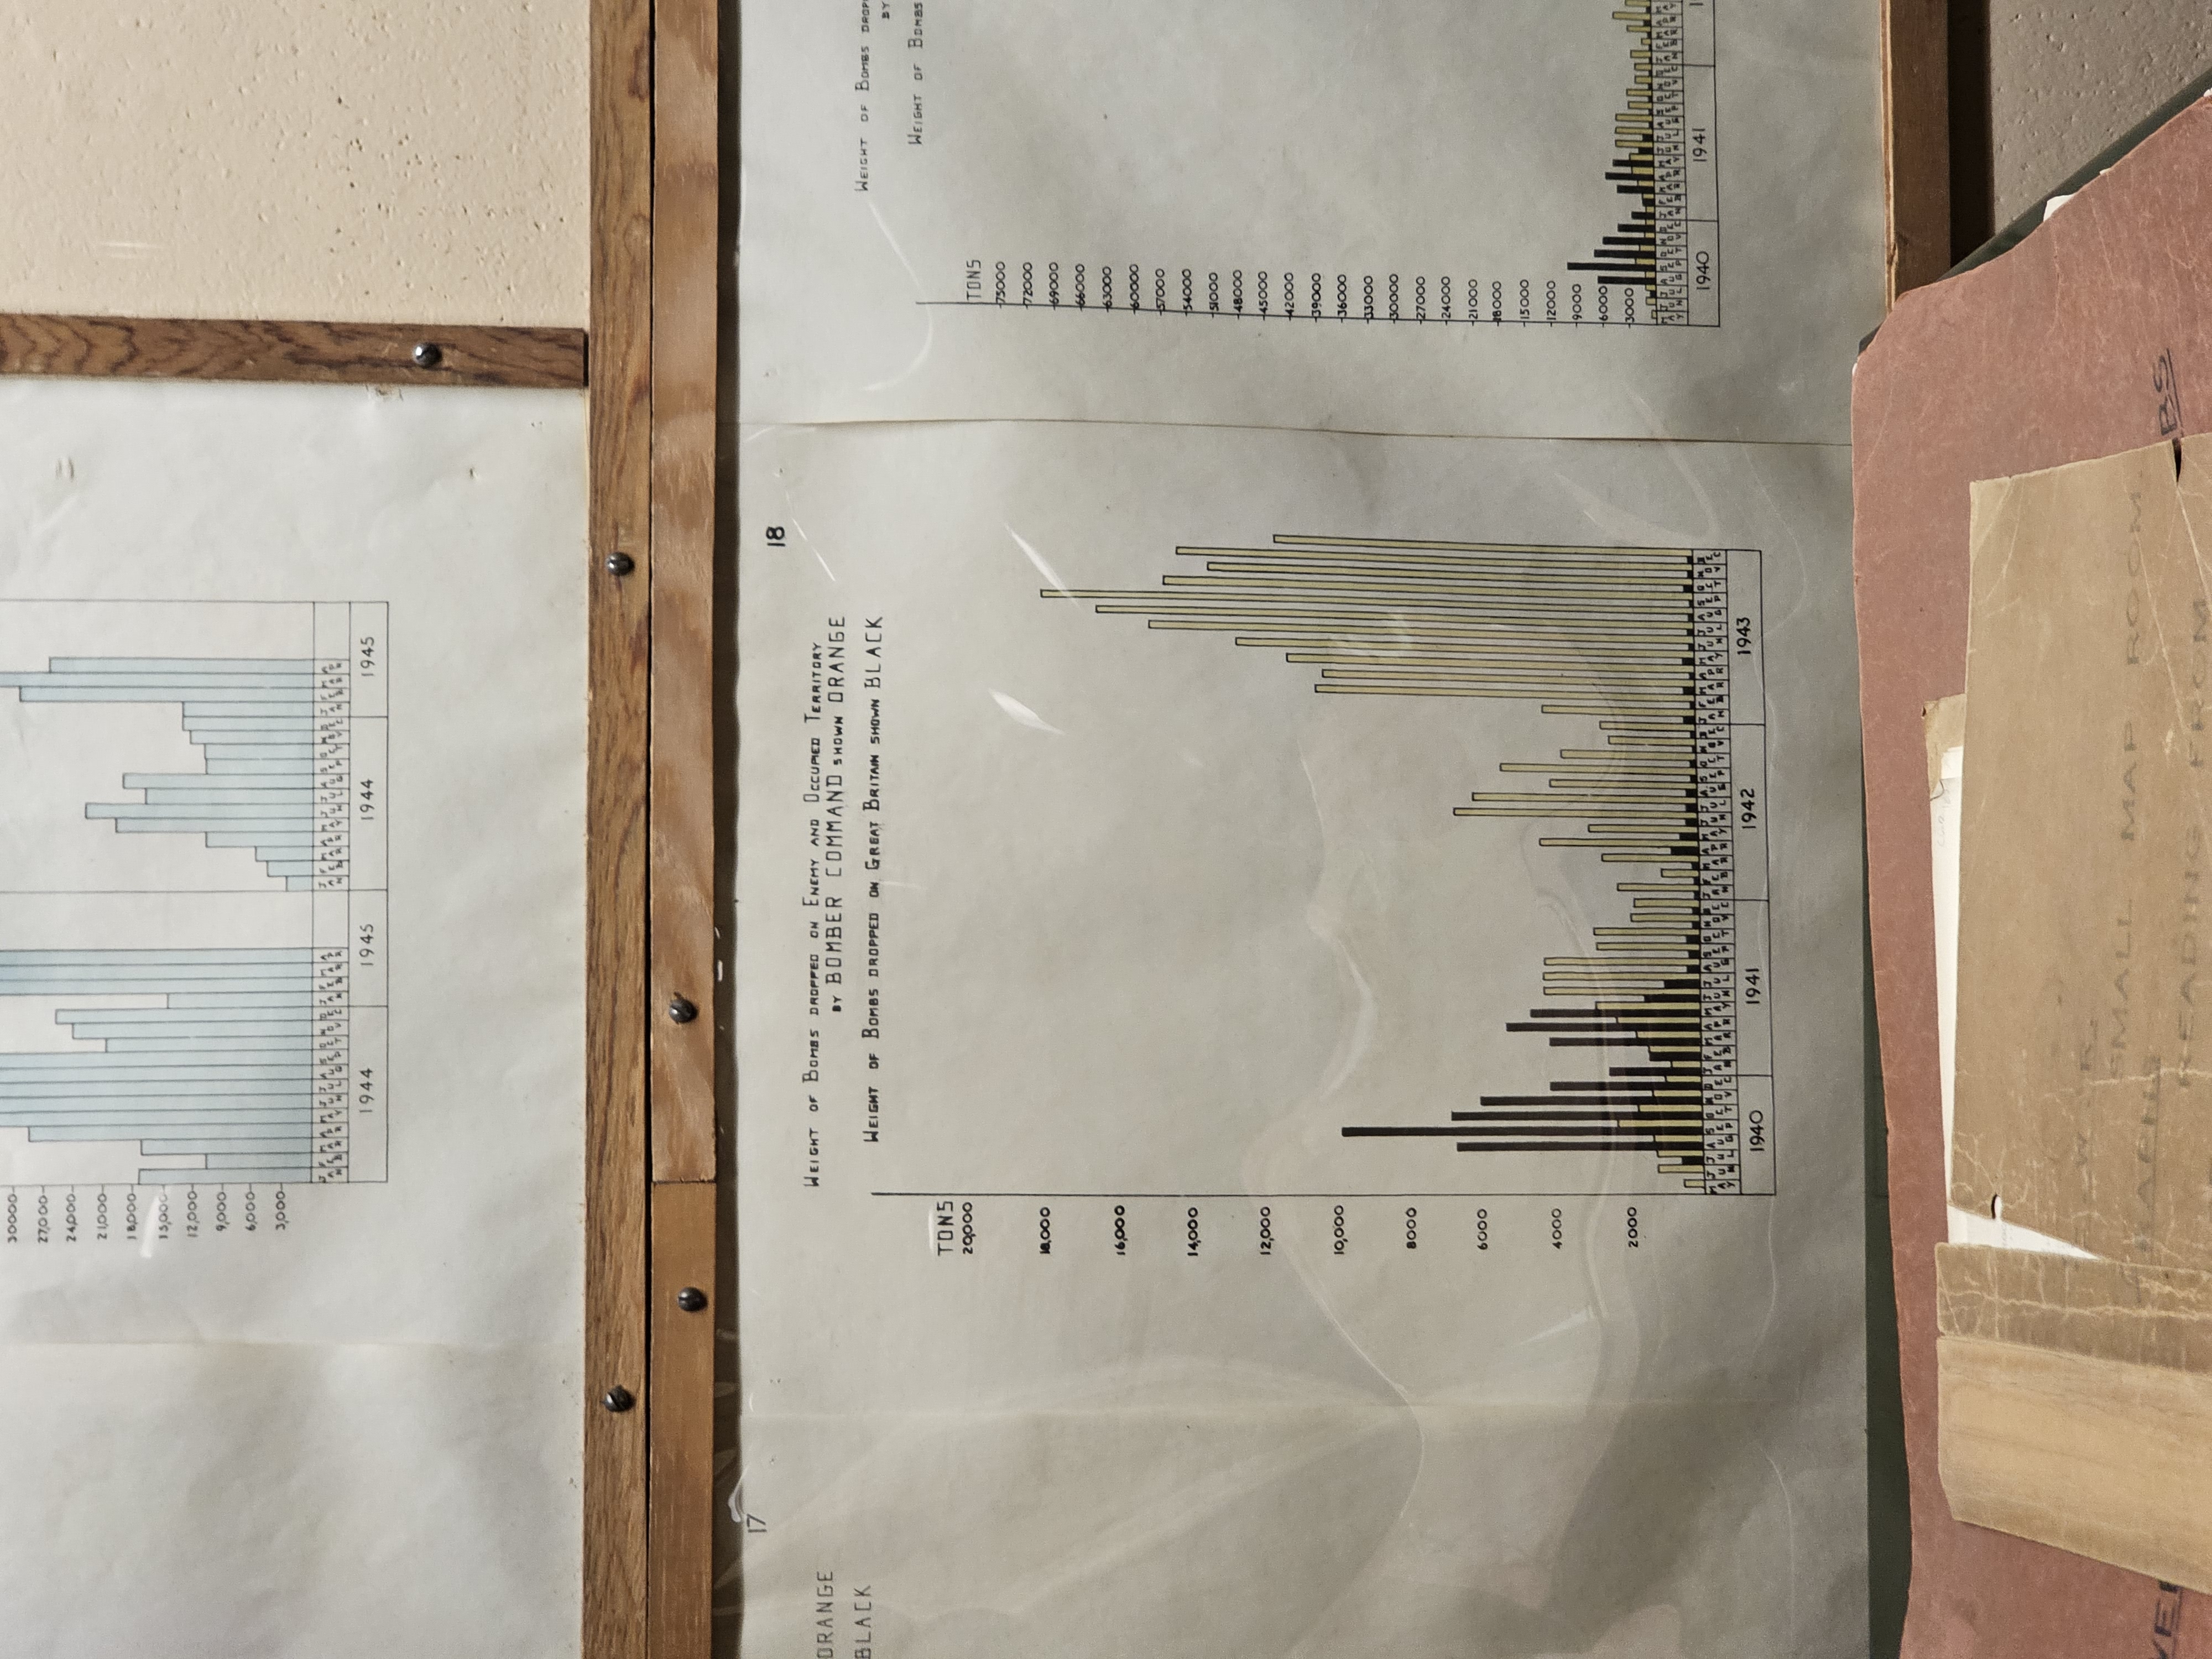
This next graph shows the weight of bombs dropped by each side. Again, think of all of the reporting going on behind the scenes here.
I think that it is a good reminder that you don't need the latest technology to make a difference.
There's real power to building things by hand, particularly when you're starting out with your reporting.
Nowadays dashboards and Power BI are great but they have added a lot of abstraction to datasets.
As a result the perceived complexity of creating these dashbboards has risen.
Practical Takeaways
Start Simple
- Begin with manual tracking if needed
- Focus on what drives decisions
- Add complexity only when justified
Make It Visual
- Put key metrics where everyone can see them
- Update frequently
- Use physical displays alongside digital
Drive Decisions
- Every chart should answer a specific question
- If a metric doesn't drive action, stop tracking it
- Create clear ownership of outcomes
The Churchill War Rooms reminded me that operational excellence isn't about having the best tools - it's about using the right tools to make better decisions faster.
Next time you're tempted to build a complex dashboard, ask yourself: "Could I draw this on paper?" If you can't, you might be overcomplicating it.
Churchill didn't win the war with Power BI. He won it by showing the right information to the right people at the right time. Sometimes, the simplest solution is the most powerful.
The good news is that we have so many amazing tools now to help us make better decisions. We just have to make sure that we have clarity on what we are trying to achieve.


