Using a can of baked beans to figure out consulting pricing

GET THE #1 EMAIL FOR EXECUTIVES
Subscribe to get the weekly email newsletter loved by 1000+ executives. It's FREE!

How does consulting differ from buying a can of baked beans?

Baked Beans: It's basically consulting
I know, it's a strange question, but bear with me. I'm using a concept called progressive elaboration to help me explain a problem. Progressive elaboration is a project management technique that allows you to start with a simple concept and build on it as you learn more.
I'm using this analogy to illustrate a key difference between consulting services and other products. The ultimate aim is to shed light and learn something around pricing consulting services.
Buying Baked Beans
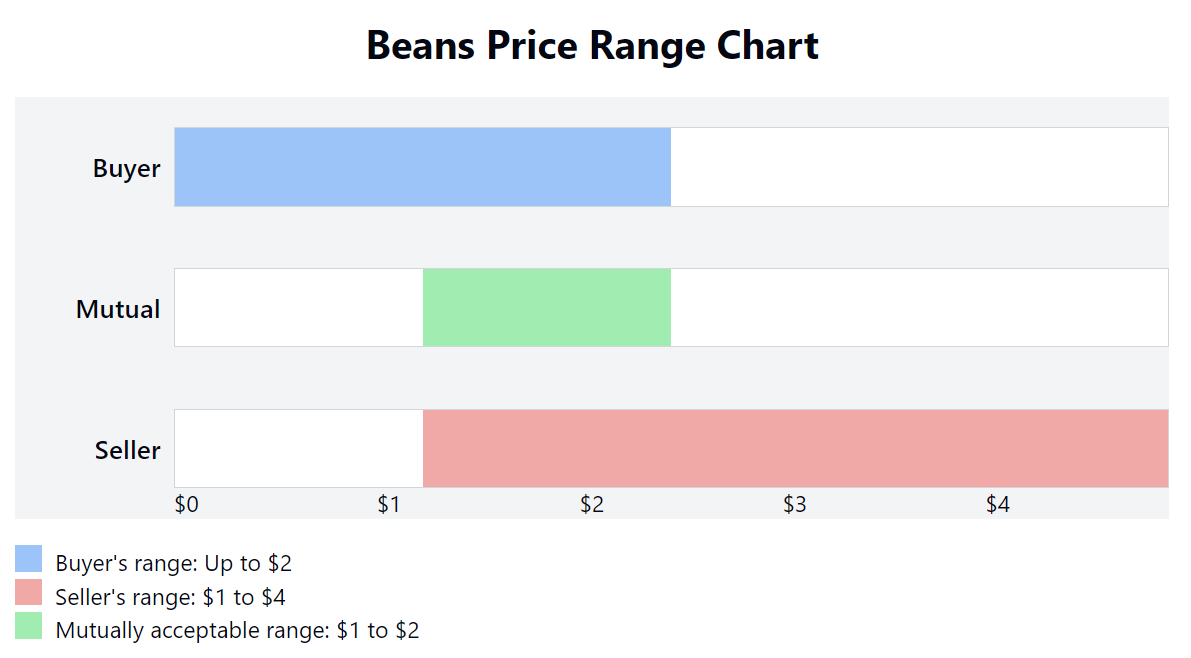
When you buy a can of baked beans, you know exactly what you are getting. You know the price, the quantity, and the quality. You can compare it to other cans of baked beans and make an informed decision.
- Buyer - I want baked beans, here is how much money I am willing to pay for this.
- Seller - Here are the beans, here is the price
Put another way, you can visualise it as a simple demand versus supply curve.
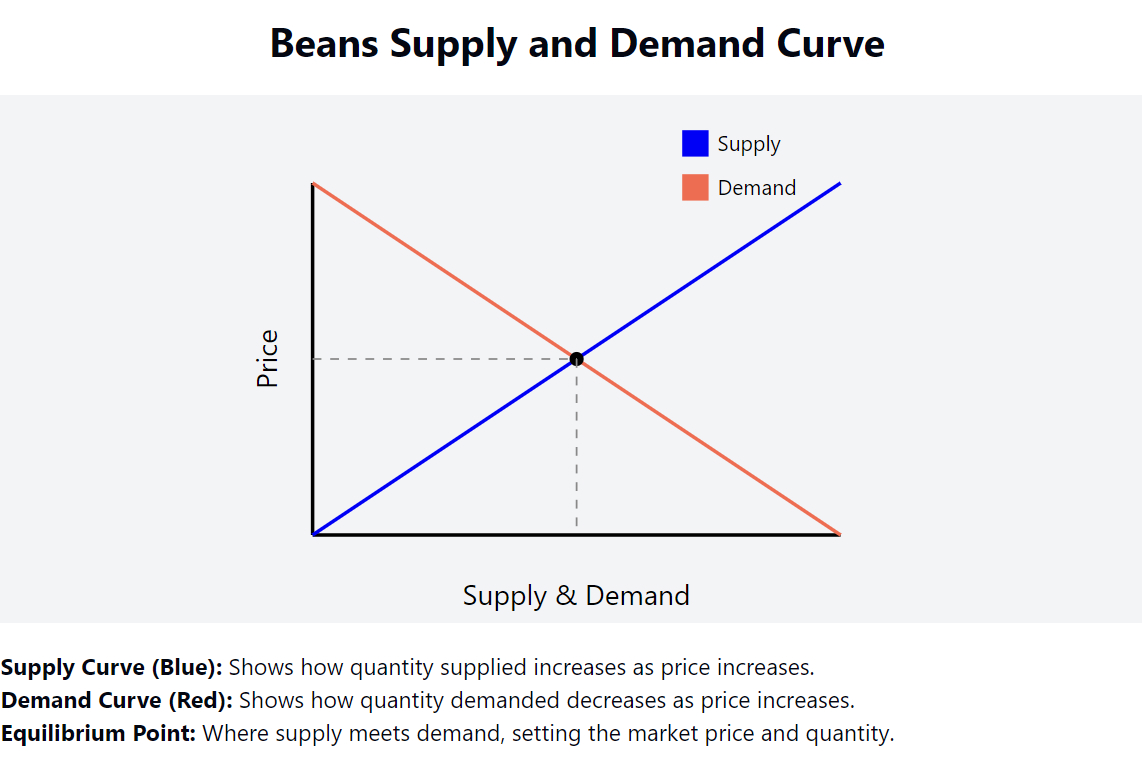
Let's whack some numbers and formulas on this simple model.
Us = Price - Cost
The utility to the seller is the price they sell the beans for minus the cost of the beans.
Ub = Value - Price
The utility to the buyer is the value they get from the beans minus the price they pay.
Consultant selling baked beans
My argument is that consultants typically price their services as though they are selling baked beans. A consultant will look at the time it takes to do the job, the cost of doing the job, and then add a margin on top.

But let's imagine for a second, that these aren't just regular beans and this isn't just a regular market. Let's imagine that these are special consulting beans and we are selling not to hungry customers, but to enterprise businesses.
Consulting Bean

What are the special properties of these beans?
-
Well, they are beans that other people are highly interested in who else has eaten before. To the point, that if someone has a friend that has eaten these beans, even 4 years ago, they are more likely to buy them.
-
Everytime you sell these beans you learn something new. You learn how to make the beans better, you learn how to sell the beans better, you learn how to make the beans faster. You learn if you need to chnage the recipe of the beans.
-
Everytime you sell the beans to a new person, it opens up the opportunity to sell more beans to other people that are similar to that person.
-
These beans have the ability to earn the buyer of the beans more money or to potentially save them money.
To Summarise
-
Future Work - The potential for future work with the client.
-
Brand Enhancement - The potential for the consulting work or the association to the client to enhance the consultant's brand.
-
Internal Skills Upgrade - When a job is finished, the consultant has often learned new skills or upgraded existing ones. There is clearly some value to this.
-
Adjacent Market Opportunities - The potential for the consulting work to open up new markets or clients.
How would this change the utlity functions?
Firstly, there would be several other things, that we would have to consider
Us = Price - Cost + α · S
The utility to the seller is the price they sell the beans for minus the cost of the beans plus some strategic value, with alpha being a coefficient that captures the strategic value of the job to the consultant.
Ub = Value - Price + β · R
The utility to the buyer is the value they get from the beans minus the price they pay plus some additional benefits, with beta being a coefficient that captures other benefits like reliability, brand value, etc., and R is a measure of these additional benefits.
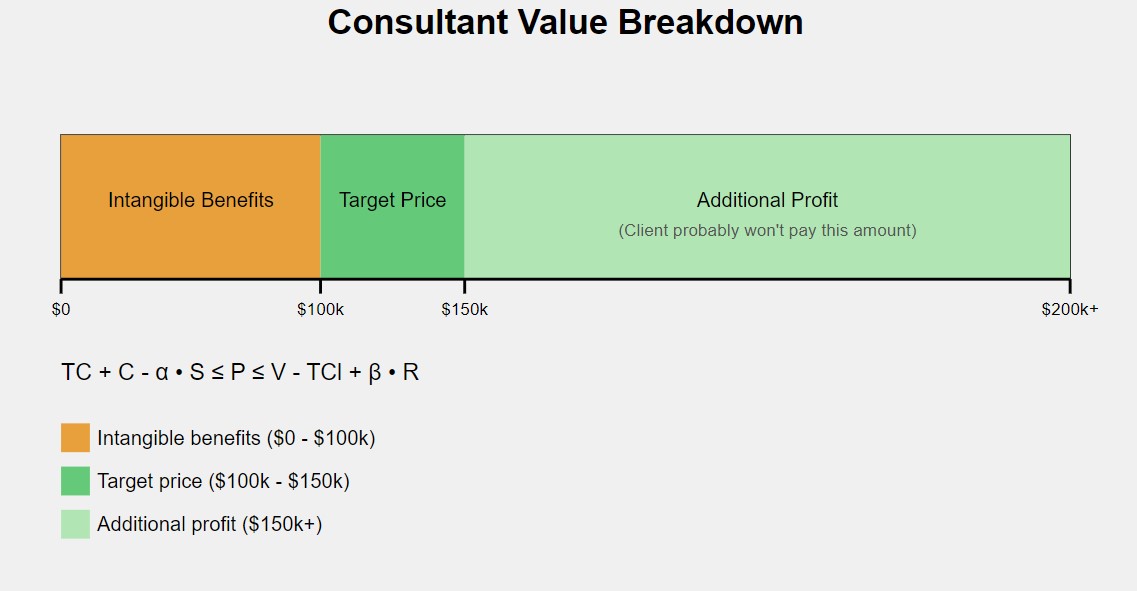
The Consultant's Utility Function
This function captures both financial and strategic benefits of a consulting job
Financial Components:
- $ P: Price charged for the service
- $ C: Cost incurred to deliver the service
Strategic Components:
- ↗ α: Coefficient for strategic value
- 🏅 S: Satisfaction and strategic benefits
Factors Included in S:
- ↗ Market Positioning
How the job helps position against competitors - 🏅 Brand Enhancement
Opportunities to enhance reputation - 📚 Learning and Development
Gains in skills or knowledge for future projects - 🧑🤝🧑 Client Network Expansion
Potential for new clients or markets
Key Considerations:
This model helps us to see some key considerations when pricing consulting services:- There is a balance between immediate financial gains (P - C) and long-term strategic benefits (α · S)
- There is an importance of accurately estimating α and S for each project
- There is potential trade-offs between financial and strategic components
- Long-term impact of strategic benefits on future consulting opportunities
Defining Alpha
Impact of Strategic Benefits on Consultancy's Value
Low
Projects that offer marginal strategic benefits, such as small gains in market visibility or minimal network expansion.
α Value: 0.05 - 0.1
Moderate
Projects that offer noticeable strategic benefits, including moderate improvements in market positioning or competence development.
α Value: 0.1 - 0.2
High
Projects that significantly enhance the consultancy's capabilities, market position, or lead to major client network expansions.
α Value: 0.2 - 0.35
Very High
Projects that are expected to transform the consultancy's market standing, open up new markets, or dramatically increase brand value.
α Value: 0.35 - 0.5
Note: α values should be adjusted based on specific project contexts and consultancy strategies.
Why is Alpha Capped at 0.5?
α at 0.5 in this model is a design choice based on a few practical considerations:α to a maximum of 0.5 ensures that the strategic value does not unrealistically outweigh the financial outcomes of a project. This prevents scenarios where a project might be pursued solely for its strategic benefits even if it doesn't meet financial expectations, which could risk the consultancy's overall financial health.
α might overemphasize the potential future benefits at the cost of current profitability. In business, while strategic advantages are important, they must be tempered with a sustainable business model that ensures profitability and operational continuity. Capping
α ensures that strategic decisions are still grounded in financial reality.By capping
α at 0.5, the model inherently incorporates a level of risk aversion, acknowledging that while strategic benefits are important, they come with uncertainties and should not be overly relied upon.α at a conservative maximum ensures that decisions are perceived as balanced and not overly speculative. This helps in managing expectations and maintaining confidence among stakeholders, particularly investors, who might be wary of strategies that place excessive emphasis on long-term, uncertain returns.
If historical data suggests that strategic benefits contribute at most to half of the utility derived from a project, setting
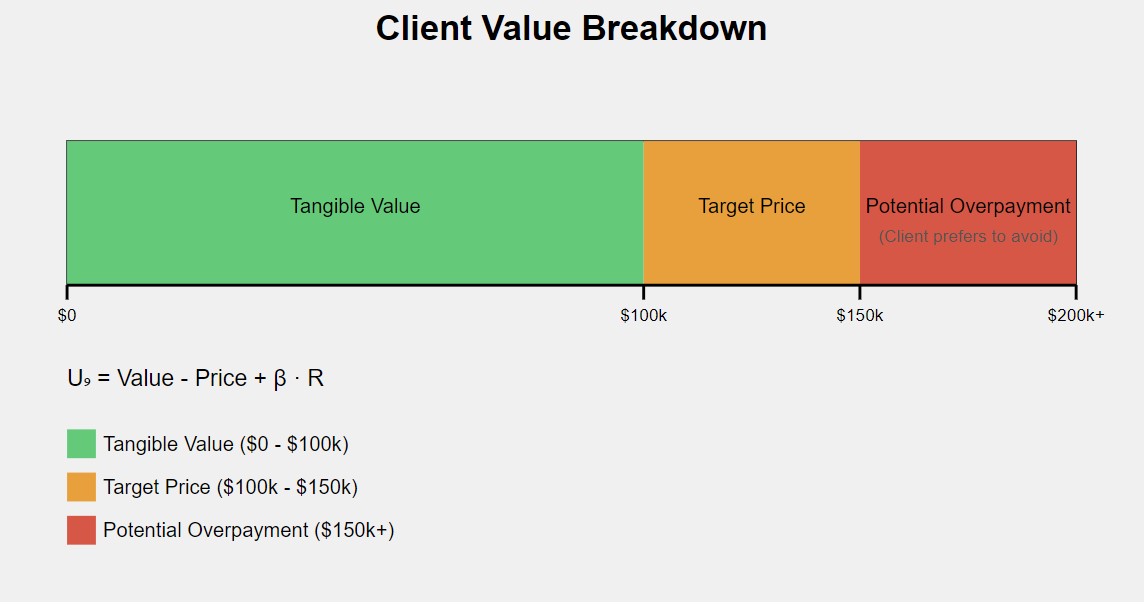
α to a maximum of 0.5 would align with such findings.Utility Function of the Client
Captures the value, cost, and additional benefits of consulting services for the client
Value and Cost Components:
- ⚡ V: Value derived from the service
- $ P: Price paid for the service
Additional Benefits:
- ↗ β: Coefficient for additional benefits
- 🏅 R: Measure of additional benefits
Factors Included in R:
- 🛡️ Reliability
Consistency and dependability of the consulting service - 🏆 Brand Value
Prestige or reputation associated with the consultant - ⚡ Expertise
Specialized knowledge or skills brought by the consultant - ↗ Long-term Impact
Potential for sustained improvements or growth
Key Considerations:
- Balance between immediate value (V - P) and additional benefits (β · R)
- Importance of accurately estimating V for proper decision-making
- The role of β in weighing the importance of intangible benefits
- Potential long-term impact of R on the client's business beyond the immediate project
- Comparison of UCl across different consulting options or alternatives
So in this case we have a clear objective function.
Objective Function:
maximize max(UC, UCl)
Where UC = Consultant's Utility, UCl = Client's Utility
Consultant's Constraint:
Client's Constraint:
Key Considerations:
- Balance between consultant's and client's utilities
- Meeting or exceeding both threshold values (TC and TCl)
- Interdependence of fee, scope, and quality in utility calculations
- Potential trade-offs between consultant and client utilities
Critical Points:
- If UC < TC: Consultant may discontinue services
- If UCl < TCl: Client may seek alternatives
- Optimal solution requires satisfying both constraints simultaneously
Unifying Formula
Bringing it all together, here is my unifying formula for the consulting model:
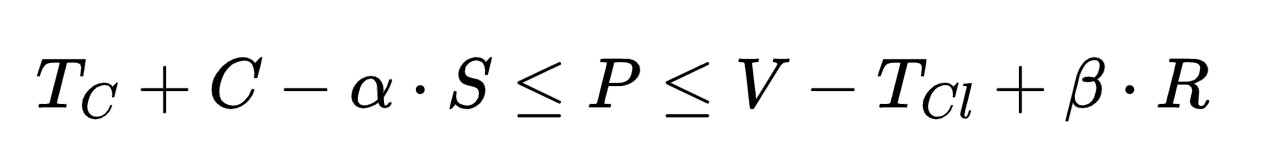
In Plain English
The price of a consulting service should be between what makes it worth it for the consultant and what the client is willing to pay based on the value they get, taking into account the strategic benefits and additional advantages that the value of the work brings to the client.
Bringing both of these graphs together, we can see the overlap of the two functions.
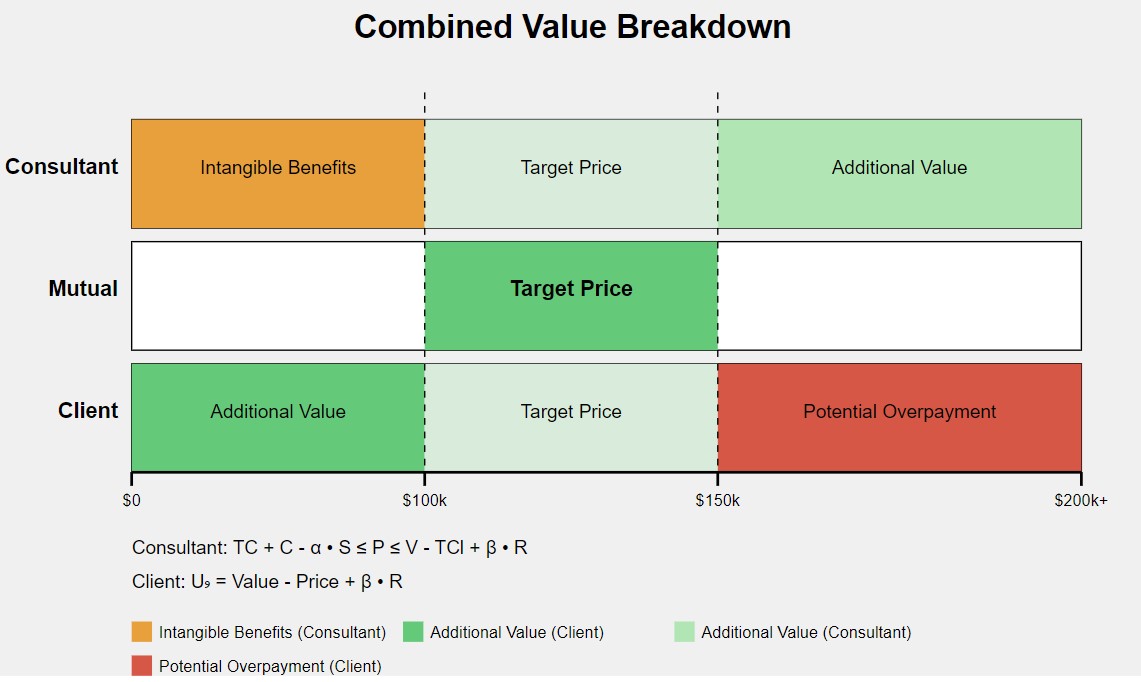
This graph should be intuitive for any consultant. Essentially the middle of the graph represents the balance between the consultant and client interests.
Key benefits of this model
I tried my best to make this blog post readible. I think the applications of this model are going to be more interesting and provide some unique insight. With that said, here are some of the key advantages of this model.
-
Value Alignment Visualisation:
- Clearly shows how a consultant and client perceptions of value align or differ.
- Helps identify potential areas of misalignment in value perception.
-
Helps illuminate the consultant blindspot:
- Highlights the strategic benefits and long-term value of consulting work.
- Encourages a more holistic approach to pricing and value assessment.
-
Pricing Strategy Insights:
- Illustrates the "sweet spot" for pricing (Target Price zone).
- Shows potential for additional value capture beyond the target price. Considering that the product you are selling most likely has it's own economic utility to the client.
-
Client Perspective Understanding:
- Highlights what clients consider as tangible value vs. potential overpayment.
- Aids in tailoring proposals to emphasize client-perceived value.
Resource - Consulting Model Table
I have created a resource to put this into practice and to help you understand the model better. You can find it here.
I intend to write a follow-up article on how to use this model in practice, and how to use it to inform pricing strategies and bid no-bid decisions.