The Most Important Data Warehousing Book

GET THE #1 EMAIL FOR EXECUTIVES
Subscribe to get the weekly email newsletter loved by 1000+ executives. It's FREE!
Introduction
This book is essentially the bible of Data Warehousing, the first edition was published in 1996 with each edition comprehensively covering more modern industries and complexities.
This post will serve as a overview to provide the core information of Kimball techniques to Data Warehousing with enough introductory information that this post can be consumed by everyone interested.
And just to be clear this post is about data warehousing and will not provide much help for your database designing for applications.
What is a Data Warehouse?
A data warehouse is a centralized source designed to store large volumes of data from various sources, enabling efficient querying and analysis. It is structured to support decision-making processes and a consistent view of an organisation's data?
How does that differ from just a Database?
Purely by differing on purpose, design and usage.
Purpose
-
Database: Designed for day-to-day operations, handling transactional data and supporting CRUD (Create, Read, Update, Delete) operations.
-
Data Warehouse: : Designed for analytical purposes, focusing on querying and reporting to support decision-making processes.
Structure
-
Database: Typically uses an OLTP (Online Transaction Processing) schema, which is normalized to reduce redundancy and ensure data integrity.
-
Data Warehouse: : Uses an OLAP (Online Analytical Processing) schema, which is often denormalized for query efficiency. We will get into this thoroughly throughout the post
Data Volatility
-
Database: Data is highly volatile, with frequent updates, inserts, and deletions as transactions occur.
-
Data Warehouse: : Data is non-volatile, meaning once it is loaded, it is not typically updated or deleted. This stability allows for consistent historical analysis.
Well how do you design a data warehouse then?
Core Design Principles
To understand the "why" of core design principles it is easiest to work backwards.
If I need to report on a business at given points of time efficiently a normal database schema isnt going to cut it. Data is going to be overwritten for only up to date data whether that be creates, updates or deletes.
So I basically need to have versioning of my data at given periods.
This is essentially the core requirement, but to version or snapshot your entire database at given periods is incredibly expensive. Not to mention that the data retrieval for reporting would be incredibly inefficient with such a basic strucutre.
The Design techniques
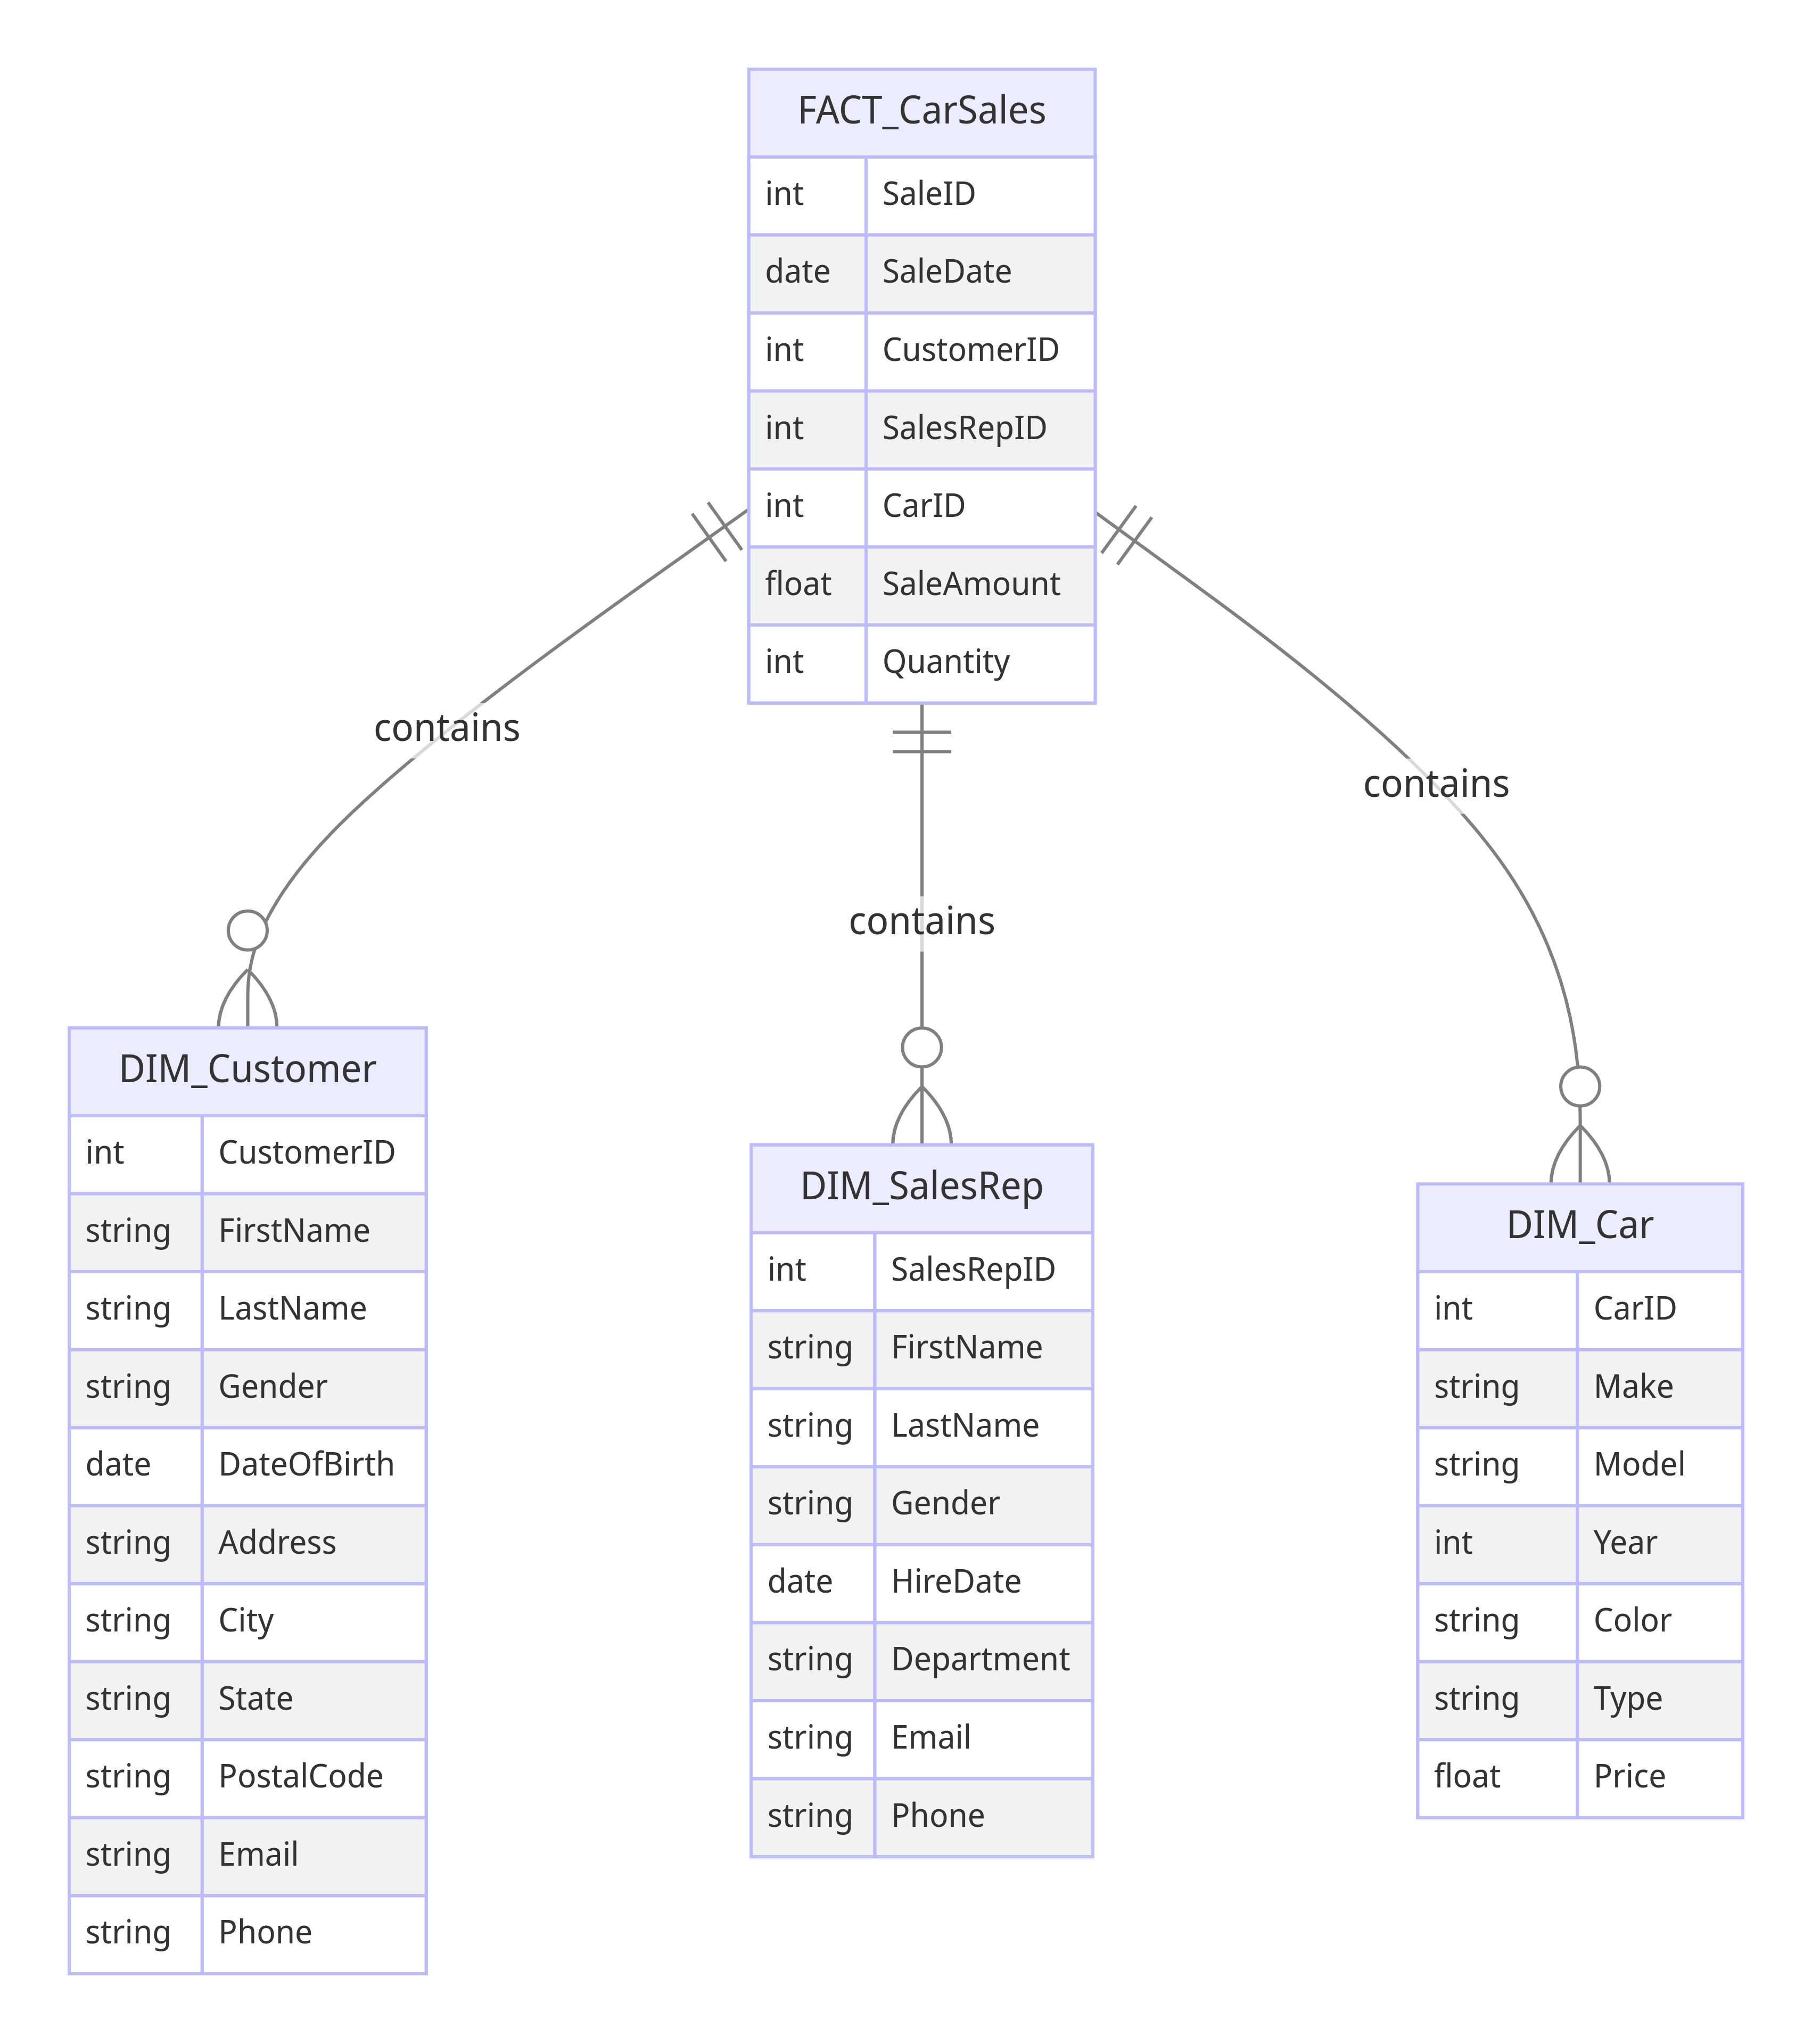
Fact and Dim. This is the backbone of Kimball techniques and most Data warehousing - fact and dimension tables.
Fact Tables
Fact tables store quantitative data about business processes, such as sales amounts or transaction counts, and are typically large and detailed. They serve as the central hub in a data warehouse schema.
Dimension Tables
Dimension tables, on the other hand, provide descriptive context to the facts, containing attributes like customer names, product descriptions, or time periods. These tables help categorize and filter the data, making it easier to analyze and report on.
Together, fact and dimension tables create a structure that is intuitive for users to query and allows for efficient, insightful analysis of business data.
How do I structure my data like this?
Essentially, the fact table represents the interactions of your business processes.
For example, if you sell cars you will want to track the sales of cars as a fact table, this would be a Transactional Fact Table (we'll get into that later).
So at any given day or for any given stretch of a period, yearly or monthly, you could report on the sales transactions.
A customer or the sales rep would be a dimension table of your sales fact table.
If you wanted to see how many sales your sales rep made you could query by the sles rep dimension table easily.
This is a really simple example but the real value comes from taking a complicated business and mapping it onto this fact-dim structure.
Because of this, unique variations of fact-dim exist which we will get into.
But first, Kimball techniques even cover fundamental concepts like information gathering.
Gathering Business Information and the "Four step design process"
Before we get to the four step design process we need to learn about the business. So the first requirement is always:
Gather Business Requirements and Data Realities
Before launching a dimensional modeling effort, the team needs to understand the needs of the business, as well as the realities of the underlying source data. You uncover the requirements via sessions with business representatives to understand their objectives based on key performance indicators, compelling business issues, decision-making processes, and supporting analytic needs.
What defines a business process?
Business processes are the operational activities performed by your organization, such as taking an order, processing an insurance claim, registering students for a class, or snapshotting every account each month. Business process events generate or capture performance metrics that translate into facts in a fact table. Most fact tables focus on the results of a single business process.
Dimensional Modelling is always collaborative
Dimensional models should not be designed in isolation by folks who don’t fully understand the business and their needs; collaboration is critical!
Dimensional models should be designed in collaboration with subject matter experts and data governance representatives from the business. The data modeler is in charge, but the model should unfold via a series of highly interactive workshops with business representatives. These workshops provide another opportunity to flesh out the requirements with the business.
So how do you design the dimensions?
The Four step design process
The four key decisions made during the design of a dimensional model include:
1. Select the business process.
2. Declare the grain.
3. Identify the dimensions.
4. Identify the facts.
Okay what is grain?
The grain establishes exactly what a single fact table row represents. The grain declaration becomes a binding contract on the design. The grain must be declared before choosing dimensions or facts because every candidate dimension or fact must be consistent with the grain.
The more complicated stuff
Not every business is just selling and only has that one business process.
Those simple requirements are what we referred to above as:
Transaction Fact Tables
Importantly a row in a transactional fact table doesn't necessarily have to be a literal transaction but is a measurement event at a point in space and time.
Atomic transaction grain fact tables are the most dimensional and expressive fact tables; this robust dimensionality enables the maximum slicing and dicing of transaction data. Transaction fact tables may be dense or sparse because rows exist only if measurements take place.
What else?
Periodic Snapshot Fact Tables
Anecdotally this is the fact table structure I have encountered the most.
A row in a periodic snapshot fact table summarizes many measurement events occurring over a standard period, such as a day, a week, or a month. The grain is the period, not the individual transaction. Periodic snapshot fact tables often contain many facts because any measurement event consistent with the fact table grain is permissible. These fact tables are always dense.
Accumulating Snapshot Fact Tables
Take an if you have to approach to this fact table strucutre, the skill ceiling and complexities of this table are very high.
A row in an accumulating snapshot fact table summarizes the measurement events occurring at predictable steps between the beginning and the end of a process. Pipeline or workflow processes, such as order fulfillment or claim processing, that have a defined start point, standard intermediate steps, and defined end point can be modeled with this type of fact table.
There is a date foreign key in the fact table for each critical milestone in the process. An individual row in an accumulating snapshot fact table, corresponding for instance to a line on an order, is initially inserted when the order line is created. As pipeline progress occurs, the accumulating fact table row is revisited and updated. This consistent updating of accumulating snapshot fact rows is unique among the three types of fact tables.
Factless Fact Tables
What are you doing here?
Although most measurement events capture numerical results, it is possible that the event merely records a set of dimensional entities coming together at a moment in time. For example, an event of a student attending a class on a given day may not have a recorded numeric fact, but a fact row with foreign keys for calendar day, student, teacher, location, and class is well-defined.
Let's get more complicated
Cubes
You may hear this occasionally, this is simply aggregating fact tables.
Aggregate fact tables are simple numeric rollups of atomic fact table data built solely to accelerate query performance.
Consolidated Fact Tables
A normalisation step to avoid needing cubes. It is often convenient to combine facts from multiple processes together into a single consolidated fact table if they can be expressed at the same grain. For example, sales actuals can be consolidated with sales forecasts in a single fact table to make the task of analyzing actuals versus forecasts simple and fast, as compared to assembling a drill-across application using separate fact tables.
Snowflaking Dimensions
Dimensions of dimensions, sometimes normalisation warrants doing this, sometimes it has to happen. Most of the time it is not a good idea due to the knowledge requirement at the reporting side. Usually, if the snowflaking is complex, it is best to denormalise data into a less or a single dimension table for ease of understanding.
How to do Dates
Not particular complicated but very fundamental.
Calendar date dimensions are attached to virtually every fact table to allow navigation of the fact table through familiar dates, months, fiscal periods, and special days on the calendar. The calendar date dimension typically has many attributes describing characteristics such as week number, month name, fiscal period, and national holiday indicator. To facilitate partitioning, the primary key of a date dimension can be more meaningful, such as an integer representing YYYYMMDD, instead of a sequentially-assigned surrogate key. However, the date dimension table needs a special row to represent unknown or to-be-determined dates. If a smart date key is used, filtering and grouping should be based on the dimension table’s attributes, not the smart key.
Conclusion
That should be a good starting point to understanding data warehousing, this book is filled with comprehensive case studies and detailed specifics like how to handle nulls which are incredibly helpful. I will likely look to make many additions to this post overtime to cover the more particular but important key takeaways.
As an Amazon Associate I earn from qualifying purchases.